Visual-fidelity edition: source-page equations, diagrams and charts are preserved as page images. Text transcripts are provided where extractable. The original source may contain markings within the artwork.
MAASStatistics
© MAAS. All rights reserved.Page 1 / 27
Extracted text · page 1
Statistics
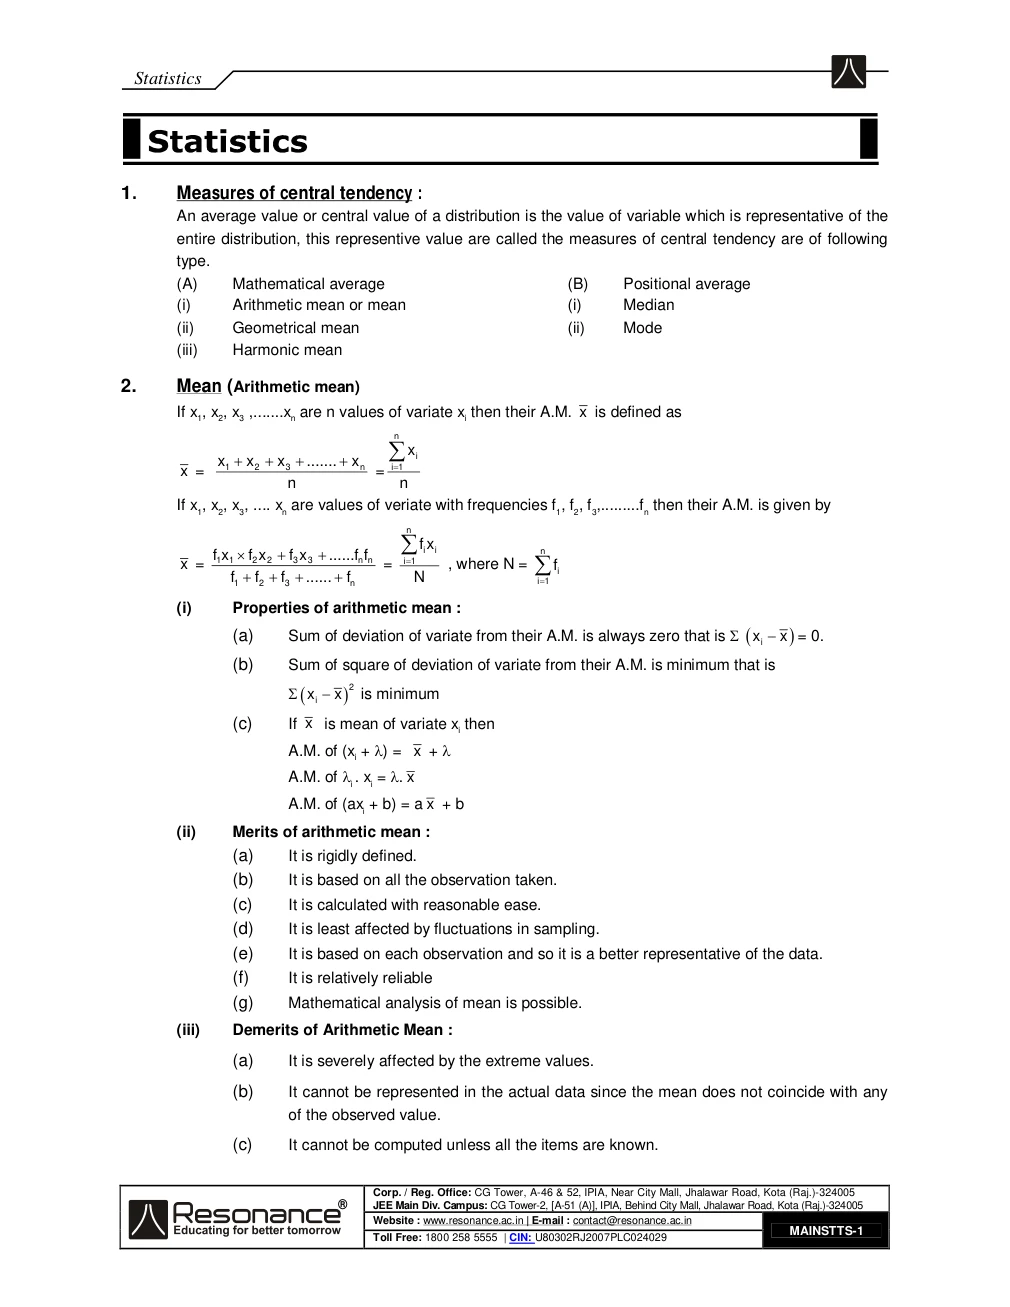
1. Measures of central tendency :
An average value or central value of a distribution is the value of variable which is representative of the
entire distribution, this representive value are called the measures of central tendency are of following
type.
(A) Mathematical average (B) Positional average
(i) Arithmetic mean or mean (i) Median
(ii) Geometrical mean (ii) Mode
(iii) Harmonic mean
2. Mean (Arithmetic mean)
If x1, x2, x3 ,.......xn are n values of variate xi then their A.M. x is defined as
n
x i x1 x 2 x 3 ....... x n i 1 x = =
n n
If x1, x2, x3, .... xn are values of veriate with frequencies f1, f2, f3,.........fn then their A.M. is given by
n
fi x i n f1 x1 f2 x 2 f3 x 3 ......fn fn i 1
x = = , where N = fi f1 f 2 f3 ...... fn N i 1
(i) Properties of arithmetic mean :
(a) Sum of deviation of variate from their A.M. is always zero that is ix x = 0.
(b) Sum of square of deviation of variate from their A.M. is minimum that is
ix x 2 is minimum
(c) If x is mean of variate xi then
A.M. of (xi + ) = x +
A.M. of i . xi = . x
A.M. of (axi + b) = a x + b
(ii) Merits of arithmetic mean :
(a) It is rigidly defined.
(b) It is based on all the observation taken.
(c) It is calculated with reasonable ease.
(d) It is least affected by fluctuations in sampling.
(e) It is based on each observation and so it is a better representative of the data.
(f) It is relatively reliable
(g) Mathematical analysis of mean is possible.
(iii) Demerits of Arithmetic Mean :
(a) It is severely affected by the extreme values.
(b) It cannot be represented in the actual data since the mean does not coincide with any
of the observed value.
(c) It cannot be computed unless all the items are known.
MAINSTTS-1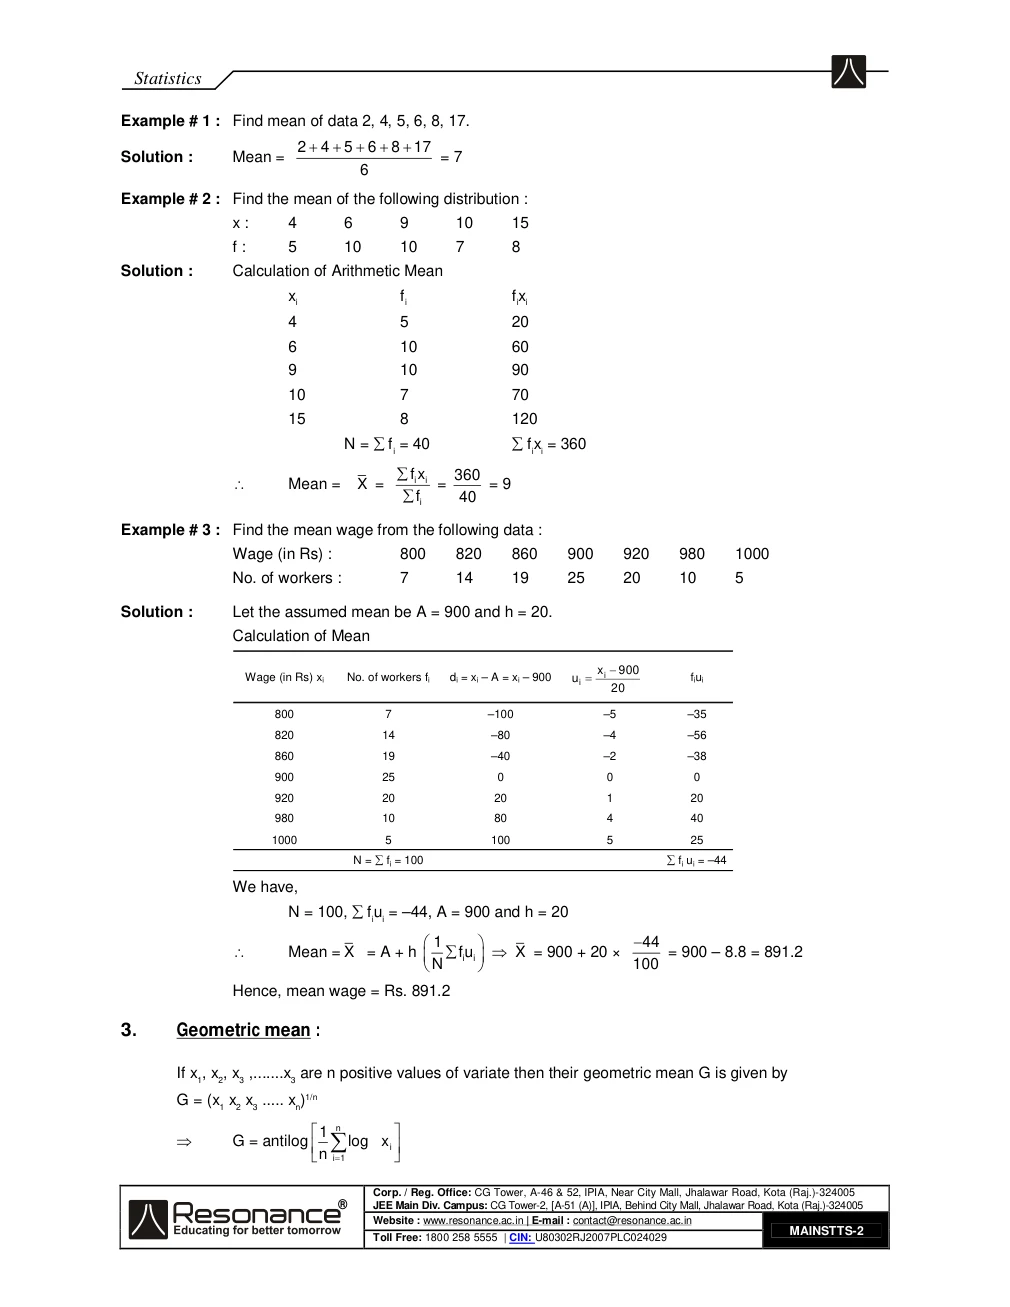
MAASStatistics
© MAAS. All rights reserved.Page 2 / 27
Extracted text · page 2
Statistics
Example # 1 : Find mean of data 2, 4, 5, 6, 8, 17.
2 4 5 6 8 17
Solution : Mean = = 7
6
Example # 2 : Find the mean of the following distribution :
x : 4 6 9 10 15
f : 5 10 10 7 8
Solution : Calculation of Arithmetic Mean
xi fi fixi
4 5 20
6 10 60
9 10 90
10 7 70
15 8 120
N = fi = 40 fixi = 360
fi x i 360 Mean = X = = = 9
fi 40
Example # 3 : Find the mean wage from the following data :
Wage (in Rs) : 800 820 860 900 920 980 1000
No. of workers : 7 14 19 25 20 10 5
Solution : Let the assumed mean be A = 900 and h = 20.
Calculation of Mean
x i 900 fiui Wage (in Rs) xi No. of workers fi di = xi – A = xi – 900 u i
20
800 7 –100 –5 –35
820 14 –80 –4 –56
860 19 –40 –2 –38
900 25 0 0 0
920 20 20 1 20
980 10 80 4 40
1000 5 100 5 25
N = fi = 100 fi ui = –44
We have,
N = 100, fiui = –44, A = 900 and h = 20
1 44
Mean = X = A + h fui i X = 900 + 20 × = 900 – 8.8 = 891.2
N 100
Hence, mean wage = Rs. 891.2
3. Geometric mean :
If x1, x2, x3 ,.......x3 are n positive values of variate then their geometric mean G is given by
G = (x1 x2 x3 ..... xn)1/n
1 n
G = antilog log x i
n i 1
MAINSTTS-2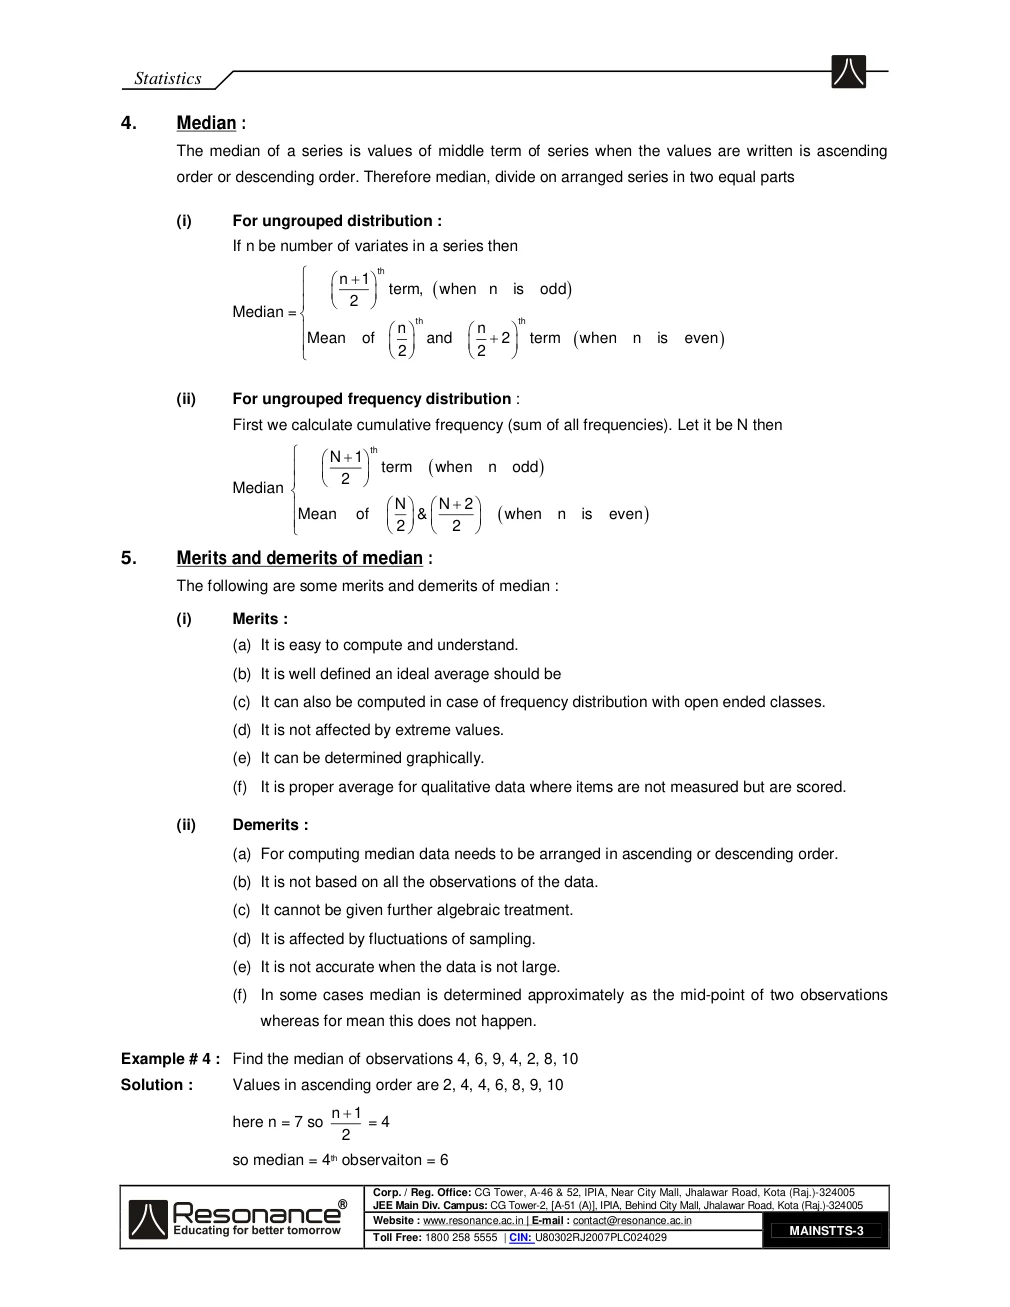
MAASStatistics
© MAAS. All rights reserved.Page 3 / 27
Extracted text · page 3
Statistics
4. Median :
The median of a series is values of middle term of series when the values are written is ascending
order or descending order. Therefore median, divide on arranged series in two equal parts
(i) For ungrouped distribution :
If n be number of variates in a series then
n 1 th
term, when n is odd
2
Median = th th
n n
Mean of and 2 term when n is even
2 2
(ii) For ungrouped frequency distribution :
First we calculate cumulative frequency (sum of all frequencies). Let it be N then
N 1 th
term when n odd
2
Median
N N 2
when n is even Mean of & 2 2
5. Merits and demerits of median :
The following are some merits and demerits of median :
(i) Merits :
(a) It is easy to compute and understand.
(b) It is well defined an ideal average should be
(c) It can also be computed in case of frequency distribution with open ended classes.
(d) It is not affected by extreme values.
(e) It can be determined graphically.
(f) It is proper average for qualitative data where items are not measured but are scored.
(ii) Demerits :
(a) For computing median data needs to be arranged in ascending or descending order.
(b) It is not based on all the observations of the data.
(c) It cannot be given further algebraic treatment.
(d) It is affected by fluctuations of sampling.
(e) It is not accurate when the data is not large.
(f) In some cases median is determined approximately as the mid-point of two observations
whereas for mean this does not happen.
Example # 4 : Find the median of observations 4, 6, 9, 4, 2, 8, 10
Solution : Values in ascending order are 2, 4, 4, 6, 8, 9, 10
n 1
here n = 7 so = 4
2
so median = 4th observaiton = 6
MAINSTTS-3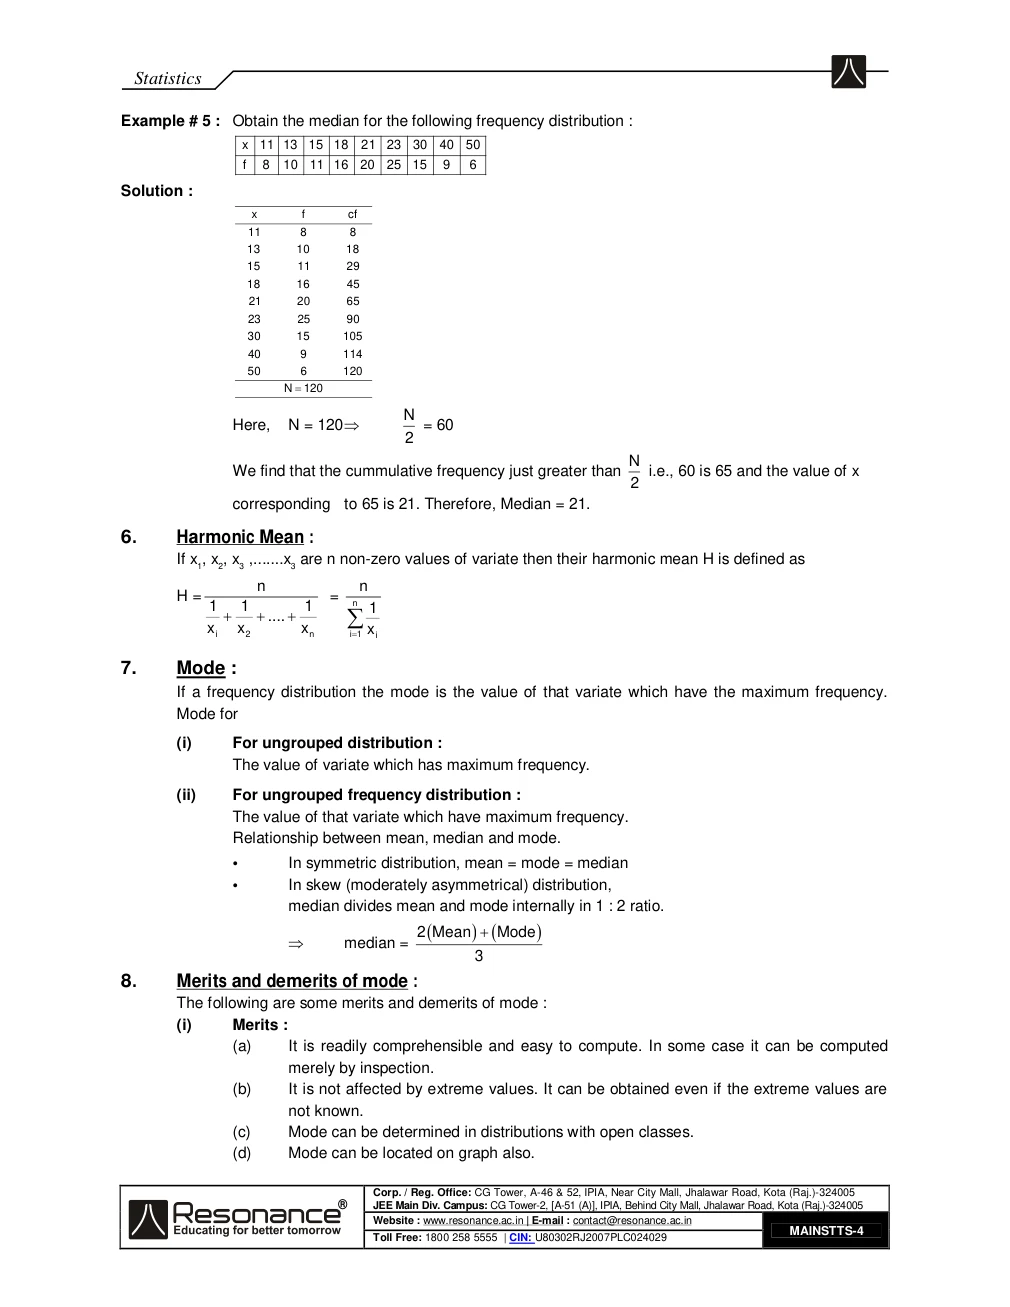
MAASStatistics
© MAAS. All rights reserved.Page 4 / 27
Extracted text · page 4
Statistics
Example # 5 : Obtain the median for the following frequency distribution :
x 11 13 15 18 21 23 30 40 50
f 8 10 11 16 20 25 15 9 6
Solution :
x f cf
11 8 8
13 10 18
15 11 29
18 16 45
21 20 65
23 25 90
30 15 105
40 9 114
50 6 120
N 120
N
Here, N = 120 = 60
2
N
We find that the cummulative frequency just greater than i.e., 60 is 65 and the value of x
2
corresponding to 65 is 21. Therefore, Median = 21.
6. Harmonic Mean :
If x1, x2, x3 ,.......x3 are n non-zero values of variate then their harmonic mean H is defined as
n n
H = = n 1 1 1 1
.... x i x 2 x n i 1 x i
7. Mode :
If a frequency distribution the mode is the value of that variate which have the maximum frequency.
Mode for
(i) For ungrouped distribution :
The value of variate which has maximum frequency.
(ii) For ungrouped frequency distribution :
The value of that variate which have maximum frequency.
Relationship between mean, median and mode.
• In symmetric distribution, mean = mode = median
• In skew (moderately asymmetrical) distribution,
median divides mean and mode internally in 1 : 2 ratio.
2 Mean Mode
median =
3
8. Merits and demerits of mode :
The following are some merits and demerits of mode :
(i) Merits :
(a) It is readily comprehensible and easy to compute. In some case it can be computed
merely by inspection.
(b) It is not affected by extreme values. It can be obtained even if the extreme values are
not known.
(c) Mode can be determined in distributions with open classes.
(d) Mode can be located on graph also.
MAINSTTS-4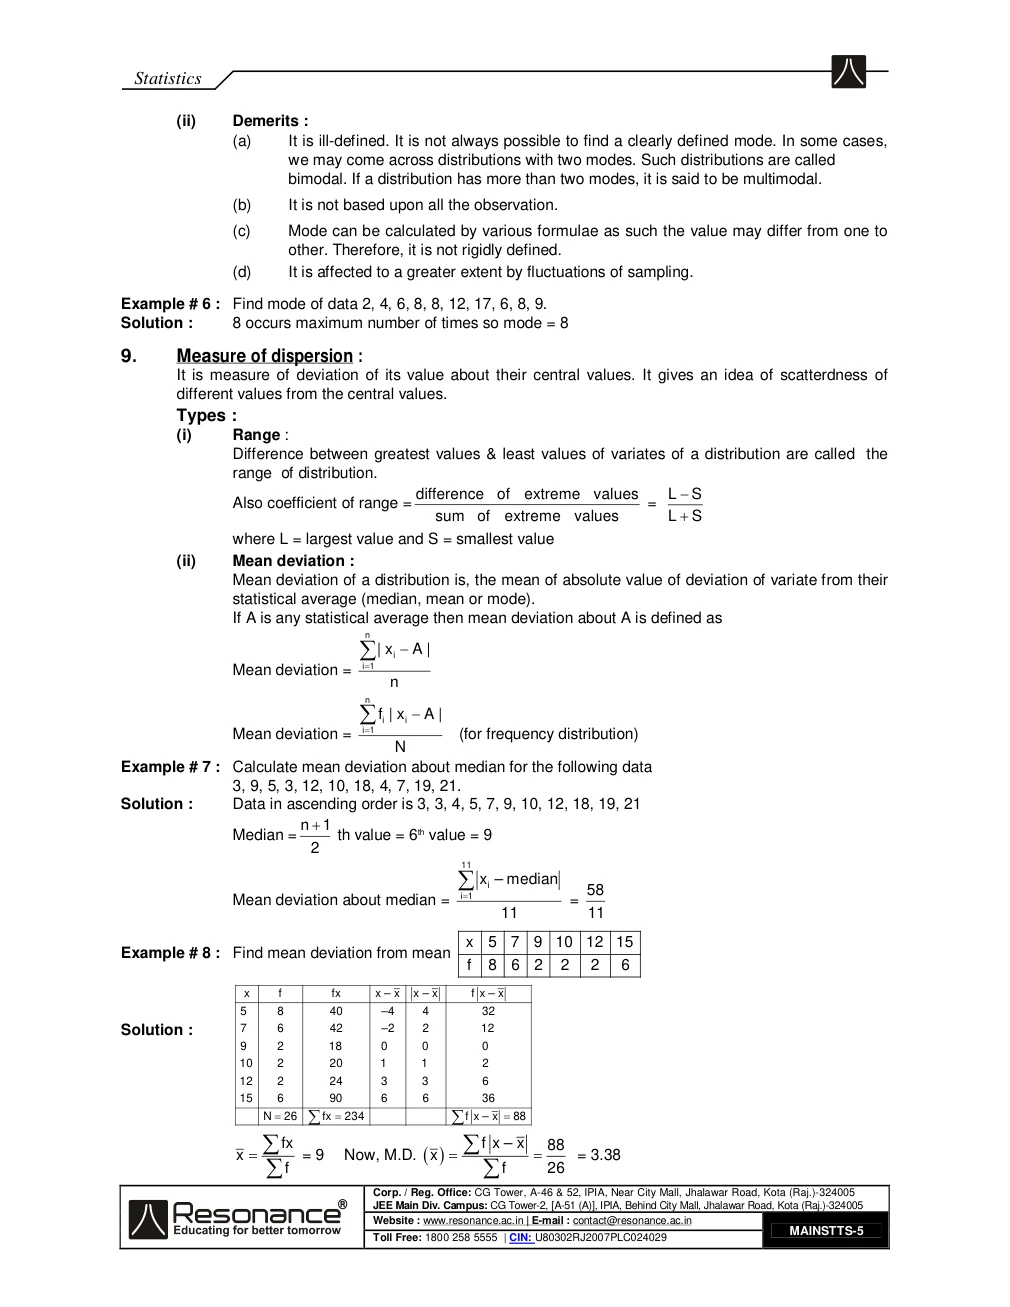
MAASStatistics
© MAAS. All rights reserved.Page 5 / 27
Extracted text · page 5
Statistics
(ii) Demerits :
(a) It is ill-defined. It is not always possible to find a clearly defined mode. In some cases,
we may come across distributions with two modes. Such distributions are called
bimodal. If a distribution has more than two modes, it is said to be multimodal.
(b) It is not based upon all the observation.
(c) Mode can be calculated by various formulae as such the value may differ from one to
other. Therefore, it is not rigidly defined.
(d) It is affected to a greater extent by fluctuations of sampling.
Example # 6 : Find mode of data 2, 4, 6, 8, 8, 12, 17, 6, 8, 9.
Solution : 8 occurs maximum number of times so mode = 8
9. Measure of dispersion :
It is measure of deviation of its value about their central values. It gives an idea of scatterdness of
different values from the central values.
Types :
(i) Range :
Difference between greatest values & least values of variates of a distribution are called the
range of distribution.
difference of extreme values L S
Also coefficient of range = =
sum of extreme values L S
where L = largest value and S = smallest value
(ii) Mean deviation :
Mean deviation of a distribution is, the mean of absolute value of deviation of variate from their
statistical average (median, mean or mode).
If A is any statistical average then mean deviation about A is defined as
n
| x i A |
Mean deviation = i 1
n
n
fi | x i A |
Mean deviation = i 1 (for frequency distribution)
N
Example # 7 : Calculate mean deviation about median for the following data
3, 9, 5, 3, 12, 10, 18, 4, 7, 19, 21.
Solution : Data in ascending order is 3, 3, 4, 5, 7, 9, 10, 12, 18, 19, 21
n 1
Median = th value = 6th value = 9
2
11
i 1 x i – median 58 Mean deviation about median = =
11 11
x 5 7 9 10 12 15
Example # 8 : Find mean deviation from mean
f 8 6 2 2 2 6
x f fx x – x x – x f x – x
5 8 40 –4 4 32
Solution : 7 6 42 –2 2 12
9 2 18 0 0 0
10 2 20 1 1 2
12 2 24 3 3 6
15 6 90 6 6 36
N 26 fx 234 f x – x 88
fx f x – x 88 x = 9 Now, M.D. x = 3.38
f f 26
MAINSTTS-5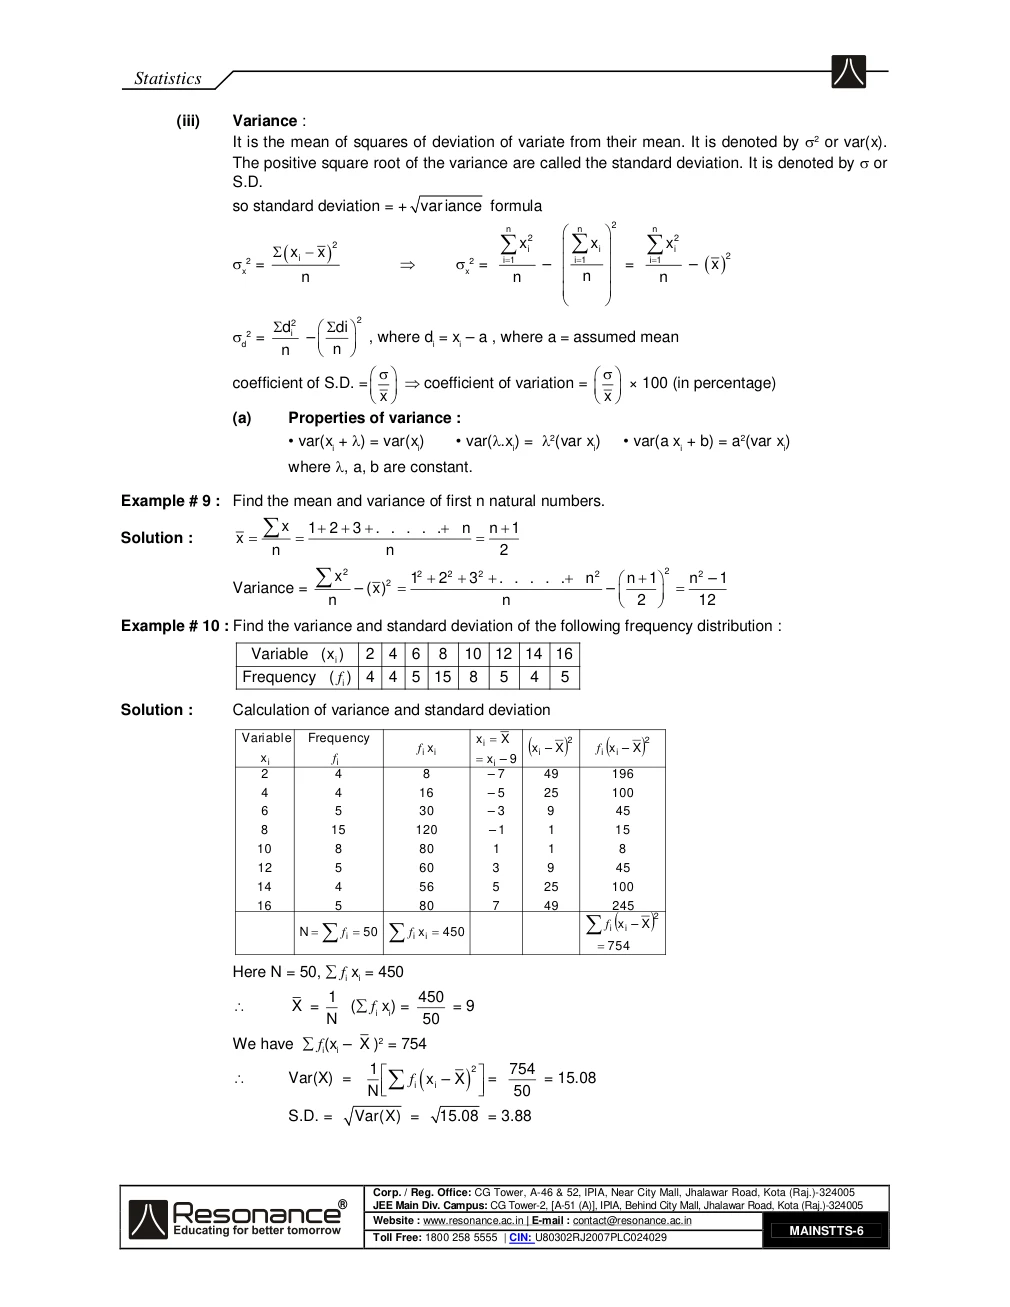
MAASStatistics
© MAAS. All rights reserved.Page 6 / 27
Extracted text · page 6
Statistics
(iii) Variance :
It is the mean of squares of deviation of variate from their mean. It is denoted by 2 or var(x).
The positive square root of the variance are called the standard deviation. It is denoted by or
S.D.
so standard deviation = + variance formula
n n 2 n
2 2
i i x i ix x 2 i 1 i 1 x i 1 x – = – x 2 x2 = x2 =
n n n n
2 id2 di 2
d = – , where di = xi – a , where a = assumed mean
n n
coefficient of S.D. = coefficient of variation = × 100 (in percentage)
x x
(a) Properties of variance :
• var(xi + ) = var(xi) • var(.xi) = 2(var xi) • var(a xi + b) = a2(var xi)
where , a, b are constant.
Example # 9 : Find the mean and variance of first n natural numbers.
x 1 2 3 . . . . . n n 1Solution : x
n n 2
x 2 2 12 2 2 3 2 . . . . . n 2 n 1 2 n 2 – 1
Variance = – (x) –
n n 2 12
Example # 10 : Find the variance and standard deviation of the following frequency distribution :
Variable (x i ) 2 4 6 8 10 12 14 16
Frequency ( f i ) 4 4 5 15 8 5 4 5
Solution : Calculation of variance and standard deviation
Variable Frequency x i X 2 2 f i x i x i – X f i x i – X
x i f i x i – 9
2 4 8 – 7 49 196
4 4 16 – 5 25 100
6 5 30 – 3 9 45
8 15 120 – 1 1 15
10 8 80 1 1 8
12 5 60 3 9 45
14 4 56 5 25 100
16 5 80 7 49 245
2
f i x i – X N f i 50 f i x i 450
754
Here N = 50, fi xi = 450
1 450
X = ( fi xi) = = 9
N 50
We have fi(xi – X )2 = 754
1 2 754 Var(X) =
N f i x i – X = 50 = 15.08
S.D. = Var(X) = 15.08 = 3.88
MAINSTTS-6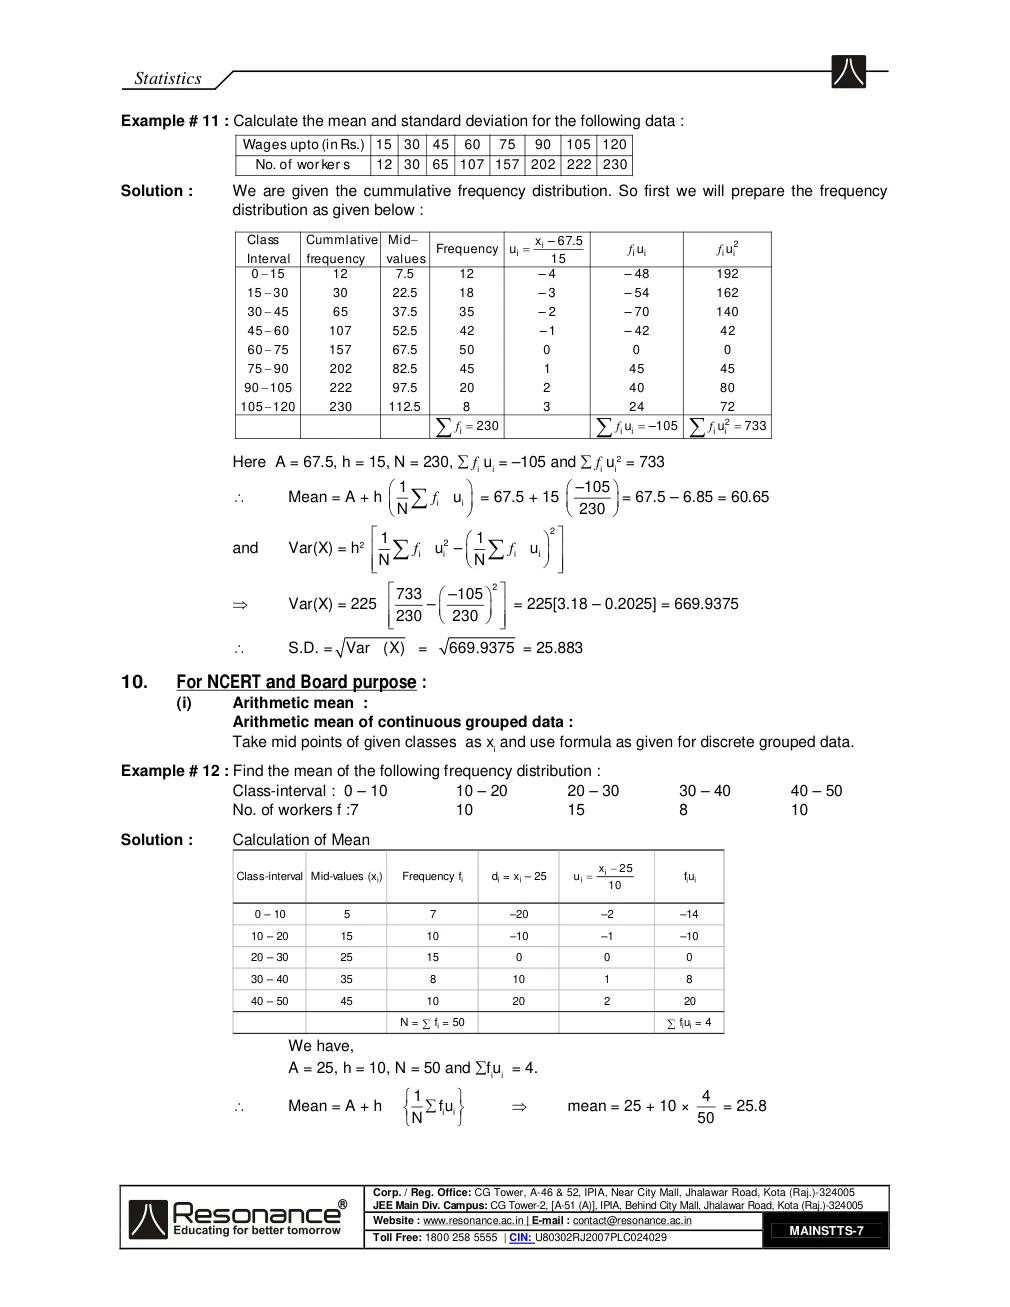
MAASStatistics
© MAAS. All rights reserved.Page 7 / 27
Extracted text · page 7
Statistics
Example # 11 : Calculate the mean and standard deviation for the following data :
Wages upto (in Rs.) 15 30 45 60 75 90 105 120
No. of wor ker s 12 30 65 107 157 202 222 230
Solution : We are given the cummulative frequency distribution. So first we will prepare the frequency
distribution as given below :
Class Cummlative Mid x i – 67. 5 2
Frequency u i f i u i f i u i
Interval frequency values 15
0 15 12 7 . 5 12 – 4 – 48 192
15 30 30 22. 5 18 – 3 – 54 162
30 45 65 37. 5 35 – 2 – 70 140
45 60 107 52. 5 42 – 1 – 42 42
60 75 157 67. 5 50 0 0 0
75 90 202 82. 5 45 1 45 45
90 105 222 97. 5 20 2 40 80
105 120 230 112. 5 8 3 24 72
f i 230 f i ui – 105 f i ui2 733
Here A = 67.5, h = 15, N = 230, fi ui = –105 and fi ui 2 = 733
1 –105
Mean = A + h f i u i = 67.5 + 15 = 67.5 – 6.85 = 60.65 N 230
1 2 1 2
and Var(X) = h2 f i ui – f i u i
N N
733 –105 2
Var(X) = 225 – = 225[3.18 – 0.2025] = 669.9375
230 230
S.D. = Var (X) = 669.9375 = 25.883
10. For NCERT and Board purpose :
(i) Arithmetic mean :
Arithmetic mean of continuous grouped data :
Take mid points of given classes as xi and use formula as given for discrete grouped data.
Example # 12 : Find the mean of the following frequency distribution :
Class-interval : 0 – 10 10 – 20 20 – 30 30 – 40 40 – 50
No. of workers f :7 10 15 8 10
Solution : Calculation of Mean
x i 25
Class-interval Mid-values (xi) Frequency fi di = xi – 25 u i fiui
10
0 – 10 5 7 –20 –2 –14
10 – 20 15 10 –10 –1 –10
20 – 30 25 15 0 0 0
30 – 40 35 8 10 1 8
40 – 50 45 10 20 2 20
N = fi = 50 fiui = 4
We have,
A = 25, h = 10, N = 50 and fiui = 4.
1 4
Mean = A + h fui i mean = 25 + 10 × = 25.8
N 50
MAINSTTS-7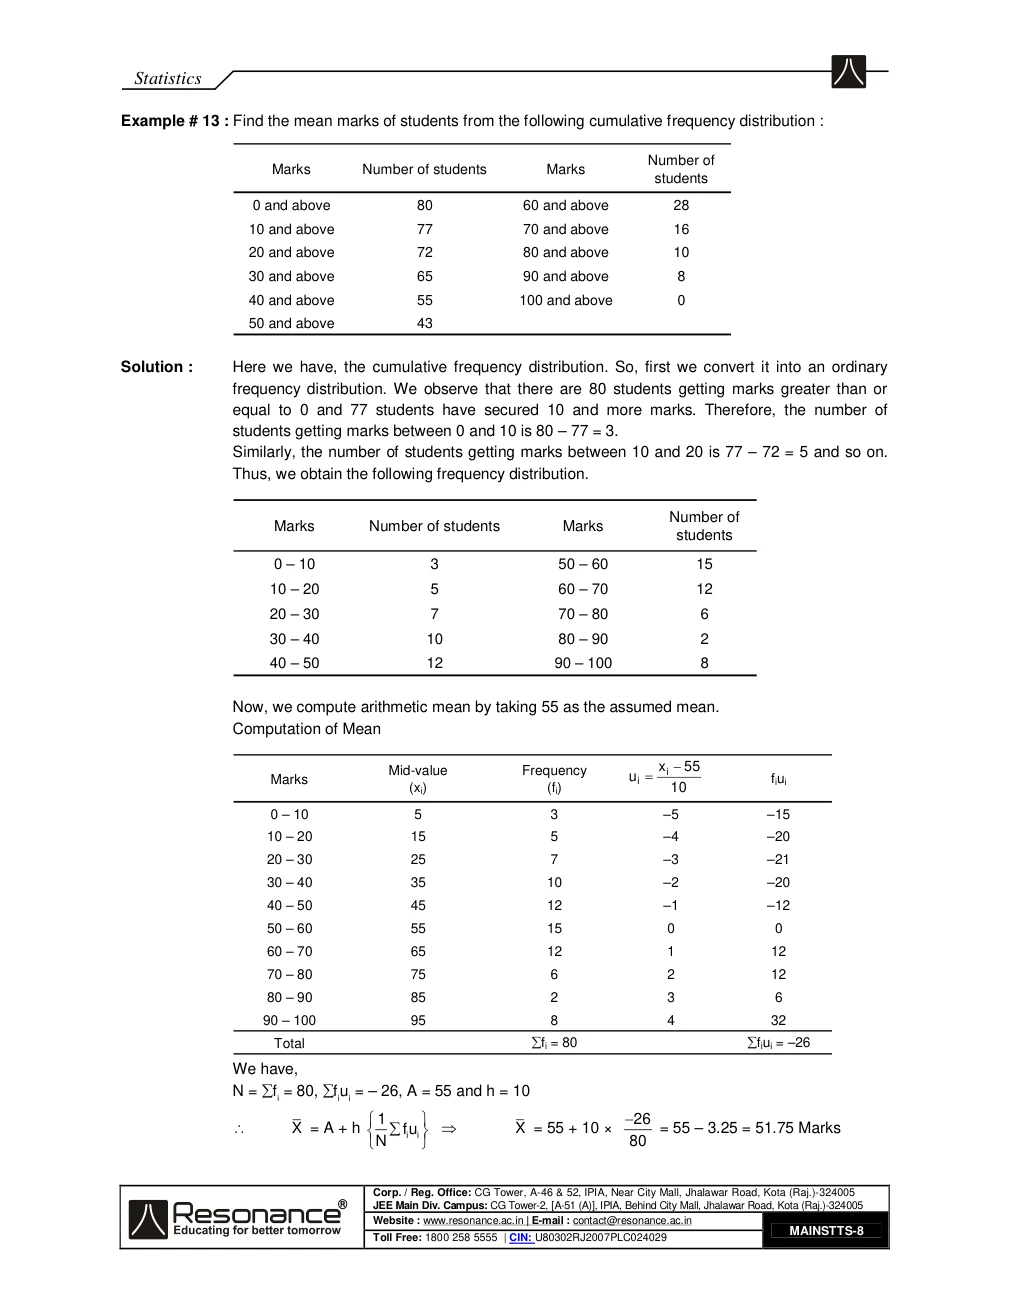
MAASStatistics
© MAAS. All rights reserved.Page 8 / 27
Extracted text · page 8
Statistics
Example # 13 : Find the mean marks of students from the following cumulative frequency distribution :
Number of
Marks Number of students Marks
students
0 and above 80 60 and above 28
10 and above 77 70 and above 16
20 and above 72 80 and above 10
30 and above 65 90 and above 8
40 and above 55 100 and above 0
50 and above 43
Solution : Here we have, the cumulative frequency distribution. So, first we convert it into an ordinary
frequency distribution. We observe that there are 80 students getting marks greater than or
equal to 0 and 77 students have secured 10 and more marks. Therefore, the number of
students getting marks between 0 and 10 is 80 – 77 = 3.
Similarly, the number of students getting marks between 10 and 20 is 77 – 72 = 5 and so on.
Thus, we obtain the following frequency distribution.
Number of
Marks Number of students Marks
students
0 – 10 3 50 – 60 15
10 – 20 5 60 – 70 12
20 – 30 7 70 – 80 6
30 – 40 10 80 – 90 2
40 – 50 12 90 – 100 8
Now, we compute arithmetic mean by taking 55 as the assumed mean.
Computation of Mean
Mid-value Frequency x i 55
Marks u i fiui
(xi) (fi) 10
0 – 10 5 3 –5 –15
10 – 20 15 5 –4 –20
20 – 30 25 7 –3 –21
30 – 40 35 10 –2 –20
40 – 50 45 12 –1 –12
50 – 60 55 15 0 0
60 – 70 65 12 1 12
70 – 80 75 6 2 12
80 – 90 85 2 3 6
90 – 100 95 8 4 32
Total fi = 80 fiui = –26
We have,
N = fi = 80, fiui = – 26, A = 55 and h = 10
1 26
X = A + h fui i X = 55 + 10 × = 55 – 3.25 = 51.75 Marks
N 80
MAINSTTS-8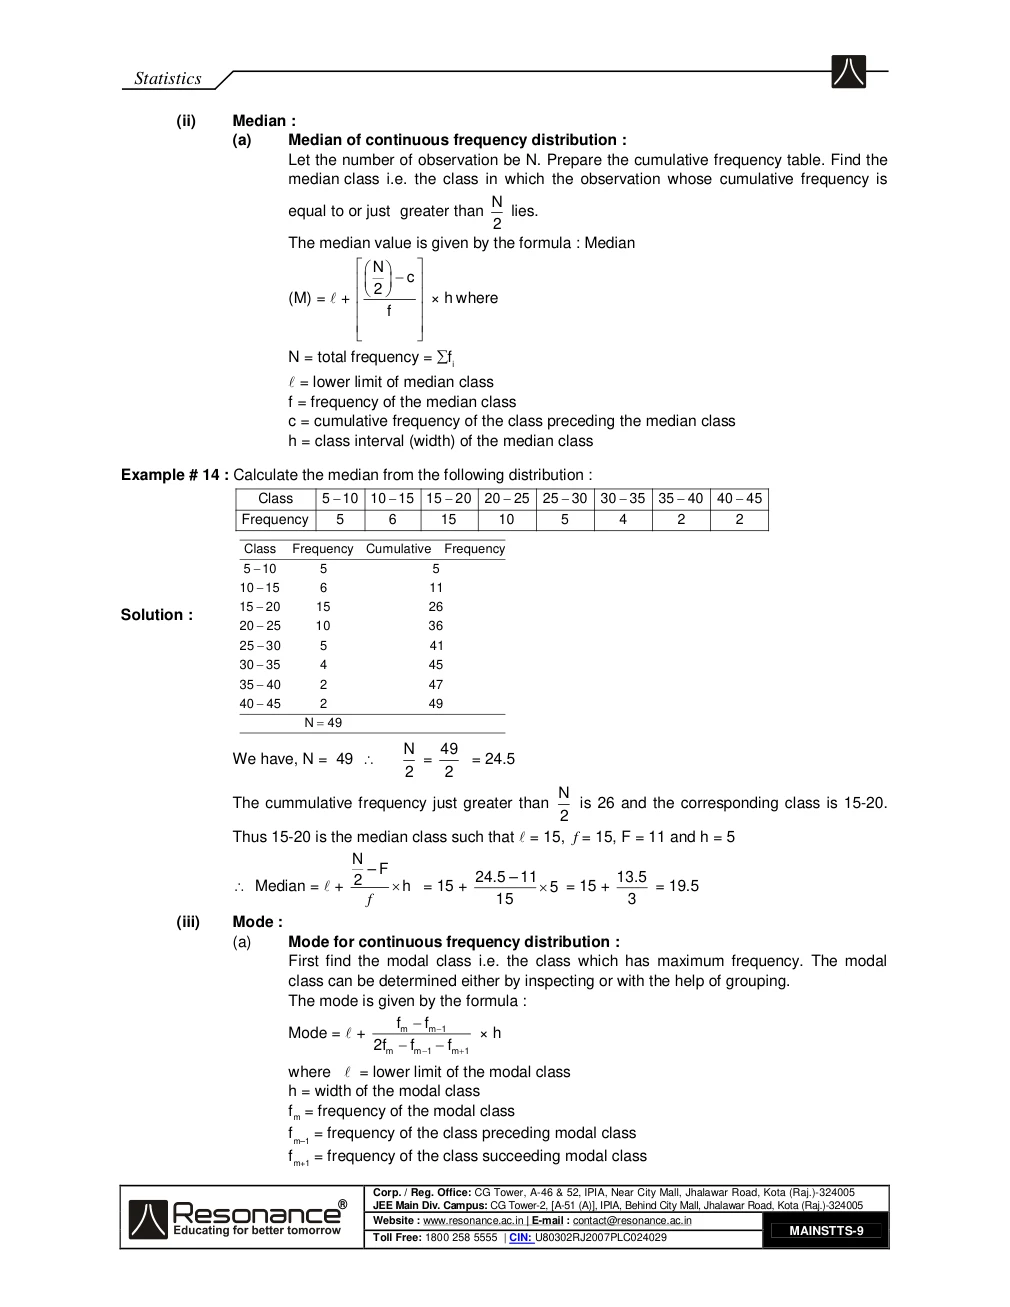
MAASStatistics
© MAAS. All rights reserved.Page 9 / 27
Extracted text · page 9
Statistics
(ii) Median :
(a) Median of continuous frequency distribution :
Let the number of observation be N. Prepare the cumulative frequency table. Find the
median class i.e. the class in which the observation whose cumulative frequency is
N
equal to or just greater than lies.
2
The median value is given by the formula : Median
N
c
2 (M) = + × h where
f
N = total frequency = fi
= lower limit of median class
f = frequency of the median class
c = cumulative frequency of the class preceding the median class
h = class interval (width) of the median class
Example # 14 : Calculate the median from the following distribution :
Class 5 10 10 15 15 20 20 25 25 30 30 35 35 40 40 45
Frequency 5 6 15 10 5 4 2 2
Class Frequency Cumulative Frequency
5 10 5 5
10 15 6 11
15 20 15 26
Solution :
20 25 10 36
25 30 5 41
30 35 4 45
35 40 2 47
40 45 2 49
N 49
N 49
We have, N = 49 = = 24.5
2 2
N
The cummulative frequency just greater than is 26 and the corresponding class is 15-20.
2
Thus 15-20 is the median class such that = 15, f = 15, F = 11 and h = 5
N
– F
2 24.5 – 11 13.5 Median = + h = 15 + 5 = 15 + = 19.5
f 15 3
(iii) Mode :
(a) Mode for continuous frequency distribution :
First find the modal class i.e. the class which has maximum frequency. The modal
class can be determined either by inspecting or with the help of grouping.
The mode is given by the formula :
fm fm 1 Mode = + × h
2fm fm 1 fm 1
where = lower limit of the modal class
h = width of the modal class
fm = frequency of the modal class
fm–1 = frequency of the class preceding modal class
fm+1 = frequency of the class succeeding modal class
MAINSTTS-9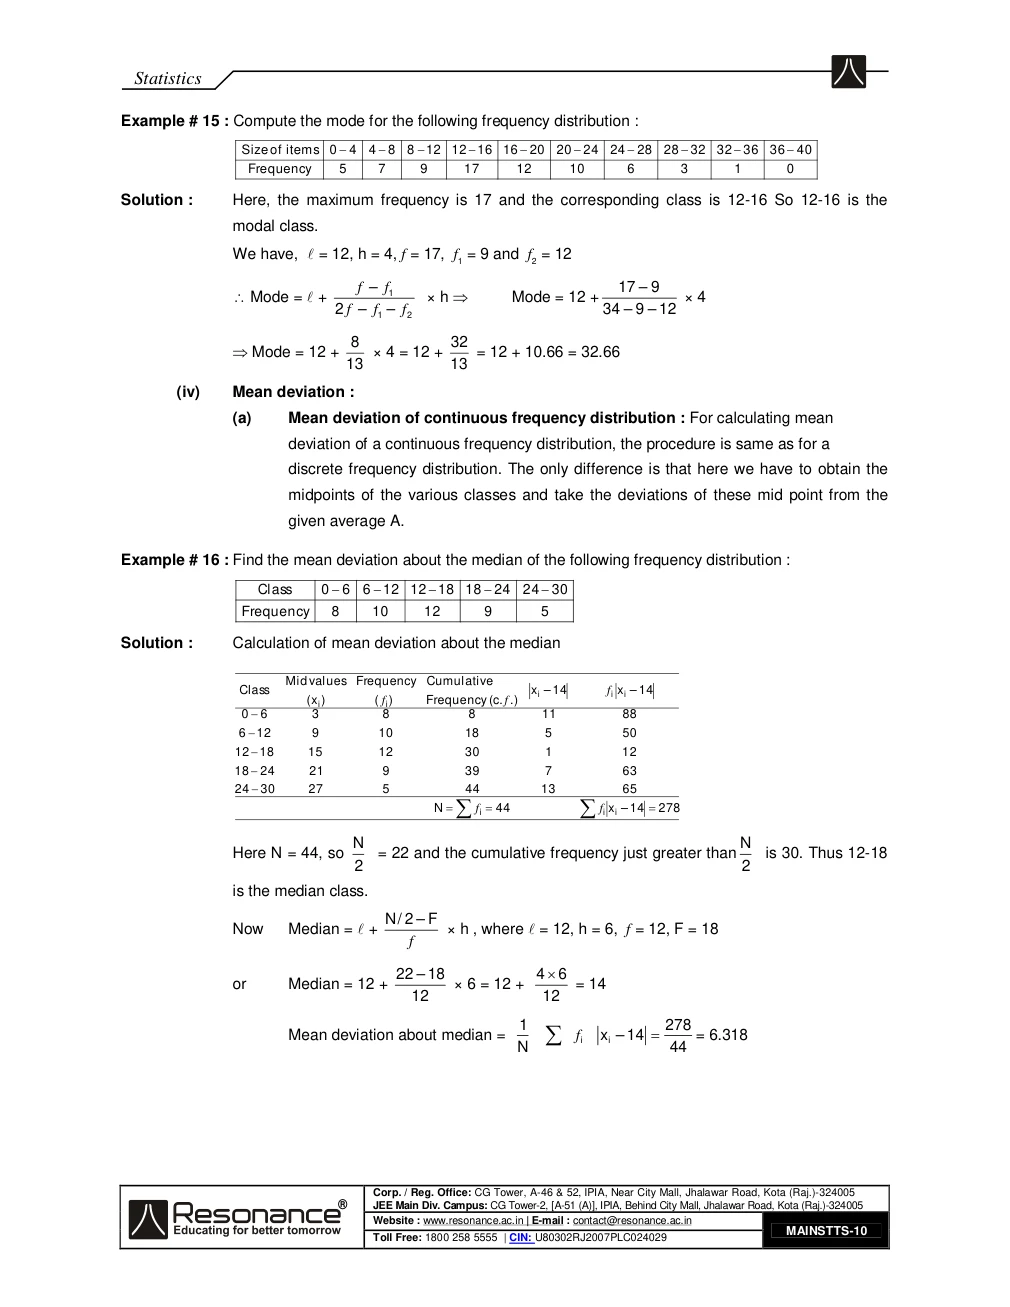
MAASStatistics
© MAAS. All rights reserved.Page 10 / 27
Extracted text · page 10
Statistics
Example # 15 : Compute the mode for the following frequency distribution :
Size of items 0 4 4 8 8 12 12 16 16 20 20 24 24 28 28 32 32 36 36 40
Frequency 5 7 9 17 12 10 6 3 1 0
Solution : Here, the maximum frequency is 17 and the corresponding class is 12-16 So 12-16 is the
modal class.
We have, = 12, h = 4, f = 17, f1 = 9 and f2 = 12
f – f1 17 – 9 Mode = + × h Mode = 12 + × 4
2 f – f1 – f 2 34 – 9 – 12
8 32
Mode = 12 + × 4 = 12 + = 12 + 10.66 = 32.66
13 13
(iv) Mean deviation :
(a) Mean deviation of continuous frequency distribution : For calculating mean
deviation of a continuous frequency distribution, the procedure is same as for a
discrete frequency distribution. The only difference is that here we have to obtain the
midpoints of the various classes and take the deviations of these mid point from the
given average A.
Example # 16 : Find the mean deviation about the median of the following frequency distribution :
Class 0 6 6 12 12 18 18 24 24 30
Frequency 8 10 12 9 5
Solution : Calculation of mean deviation about the median
Mid values Frequency Cumulative
Class x i – 14 f i x i – 14
( x i ) ( f i ) Frequency (.c f .)
0 6 3 8 8 11 88
6 12 9 10 18 5 50
12 18 15 12 30 1 12
18 24 21 9 39 7 63
24 30 27 5 44 13 65
N f i 44 f i x i – 14 278
N N
Here N = 44, so = 22 and the cumulative frequency just greater than is 30. Thus 12-18
2 2
is the median class.
N/ 2 – F
Now Median = + × h , where = 12, h = 6, f = 12, F = 18
f
22 – 18 4 6
or Median = 12 + × 6 = 12 + = 14
12 12
1 278
Mean deviation about median = f i x i – 14 = 6.318 N 44
MAINSTTS-10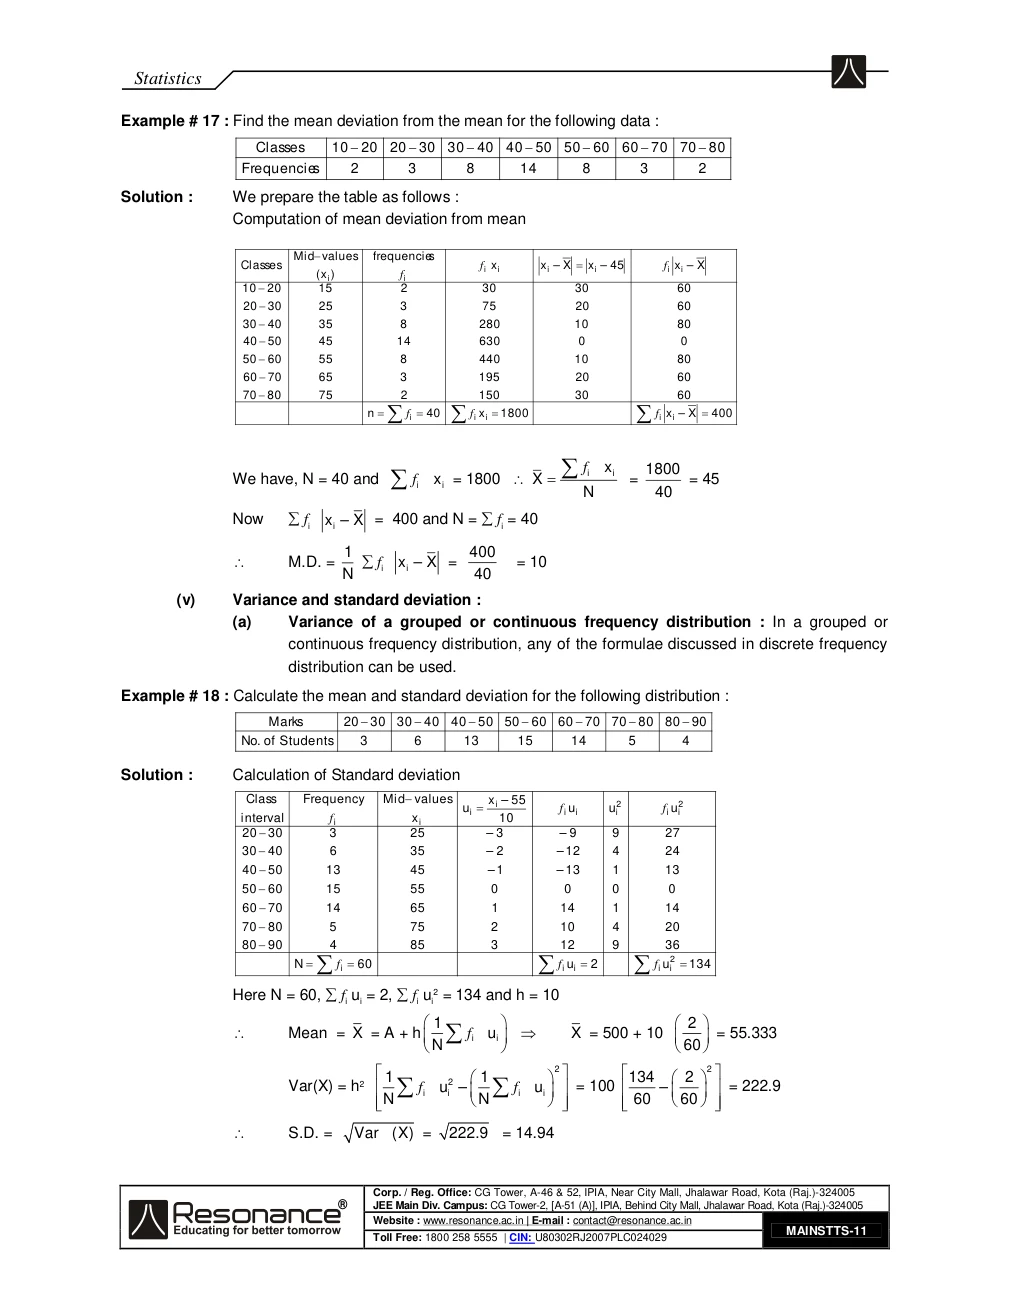
MAASStatistics
© MAAS. All rights reserved.Page 11 / 27
Extracted text · page 11
Statistics
Example # 17 : Find the mean deviation from the mean for the following data :
Classes 10 20 20 30 30 40 40 50 50 60 60 70 70 80
Frequencies 2 3 8 14 8 3 2
Solution : We prepare the table as follows :
Computation of mean deviation from mean
Mid values frequencies
Classes f i x i x i – X x i – 45 f i x i – X
( x i ) f i
10 20 15 2 30 30 60
20 30 25 3 75 20 60
30 40 35 8 280 10 80
40 50 45 14 630 0 0
50 60 55 8 440 10 80
60 70 65 3 195 20 60
70 80 75 2 150 30 60
n f i 40 f i x i 1800 f i x i – X 400
i ix 1800 f = = 45 We have, N = 40 and f i ix = 1800 X N 40
Now fi ix – X = 400 and N = fi = 40
1 400
M.D. = fi ix – X = = 10
N 40
(v) Variance and standard deviation :
(a) Variance of a grouped or continuous frequency distribution : In a grouped or
continuous frequency distribution, any of the formulae discussed in discrete frequency
distribution can be used.
Example # 18 : Calculate the mean and standard deviation for the following distribution :
Marks 20 30 30 40 40 50 50 60 60 70 70 80 80 90
No. of Students 3 6 13 15 14 5 4
Solution : Calculation of Standard deviation
Class Frequency Mid values x i – 55 2 2
u i f i u i u i f i u i
int erval f i x i 10
20 30 3 25 – 3 – 9 9 27
30 40 6 35 – 2 – 12 4 24
40 50 13 45 – 1 – 13 1 13
50 60 15 55 0 0 0 0
60 70 14 65 1 14 1 14
70 80 5 75 2 10 4 20
80 90 4 85 3 12 9 36
N f i 60 f i u i 2 f i u i2 134
Here N = 60, fi ui = 2, fi ui 2 = 134 and h = 10
1 2
Mean = X = A + h f i u i X = 500 + 10 = 55.333 N 60
1 2 1 2 134 2 2
Var(X) = h2 f i ui – f i u i = 100 – = 222.9
N N 60 60
S.D. = Var (X) = 222.9 = 14.94
MAINSTTS-11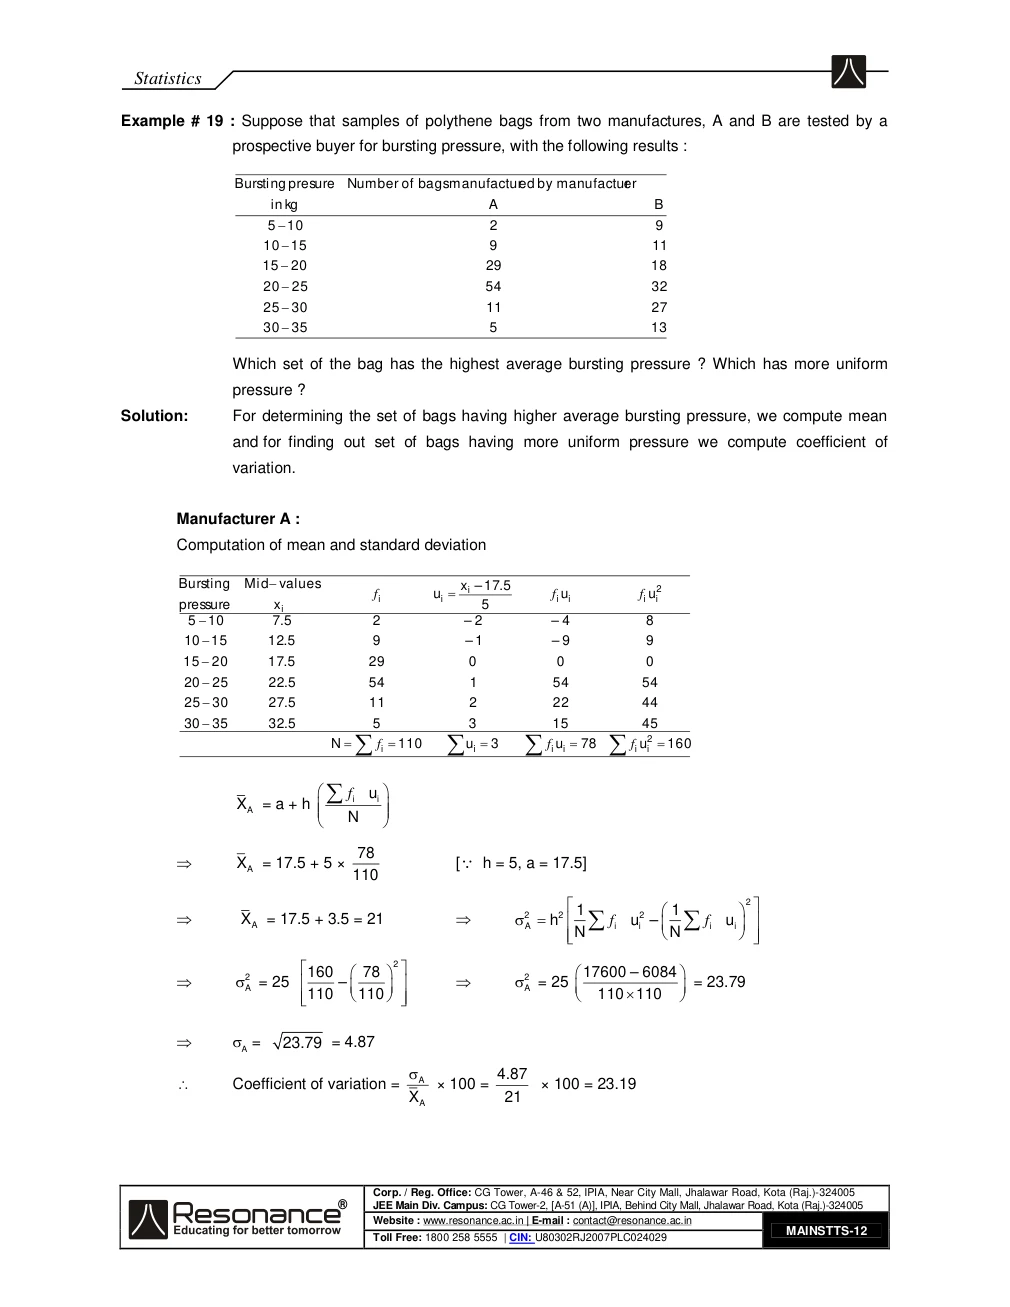
MAASStatistics
© MAAS. All rights reserved.Page 12 / 27
Extracted text · page 12
Statistics
Example # 19 : Suppose that samples of polythene bags from two manufactures, A and B are tested by a
prospective buyer for bursting pressure, with the following results :
Bursting presure Number of bagsmanufactured by manufacturer
in kg A B
5 10 2 9
10 15 9 11
15 20 29 18
20 25 54 32
25 30 11 27
30 35 5 13
Which set of the bag has the highest average bursting pressure ? Which has more uniform
pressure ?
Solution: For determining the set of bags having higher average bursting pressure, we compute mean
and for finding out set of bags having more uniform pressure we compute coefficient of
variation.
Manufacturer A :
Computation of mean and standard deviation
Bursting Mid values x i – 17. 5 2
f i ui f i ui f i ui
pressure x i 5
5 10 7. 5 2 – 2 – 4 8
10 15 12. 5 9 – 1 – 9 9
15 20 17. 5 29 0 0 0
20 25 22. 5 54 1 54 54
25 30 27. 5 11 2 22 44
30 35 32. 5 5 3 15 45
N f i 110 u i 3 f i ui 78 f i u2i 160
f i iu X A = a + h N
78
X A = 17.5 + 5 × [ h = 5, a = 17.5]
110
2 2 1 2 1 2
X A = 17.5 + 3.5 = 21 A h f i ui – f i u i
N N
2 160 78 2 2 17600 – 6084
A = 25 – A = 25 = 23.79
110 110 110 110
A = 23.79 = 4.87
A 4.87 Coefficient of variation = × 100 = × 100 = 23.19
X A 21
MAINSTTS-12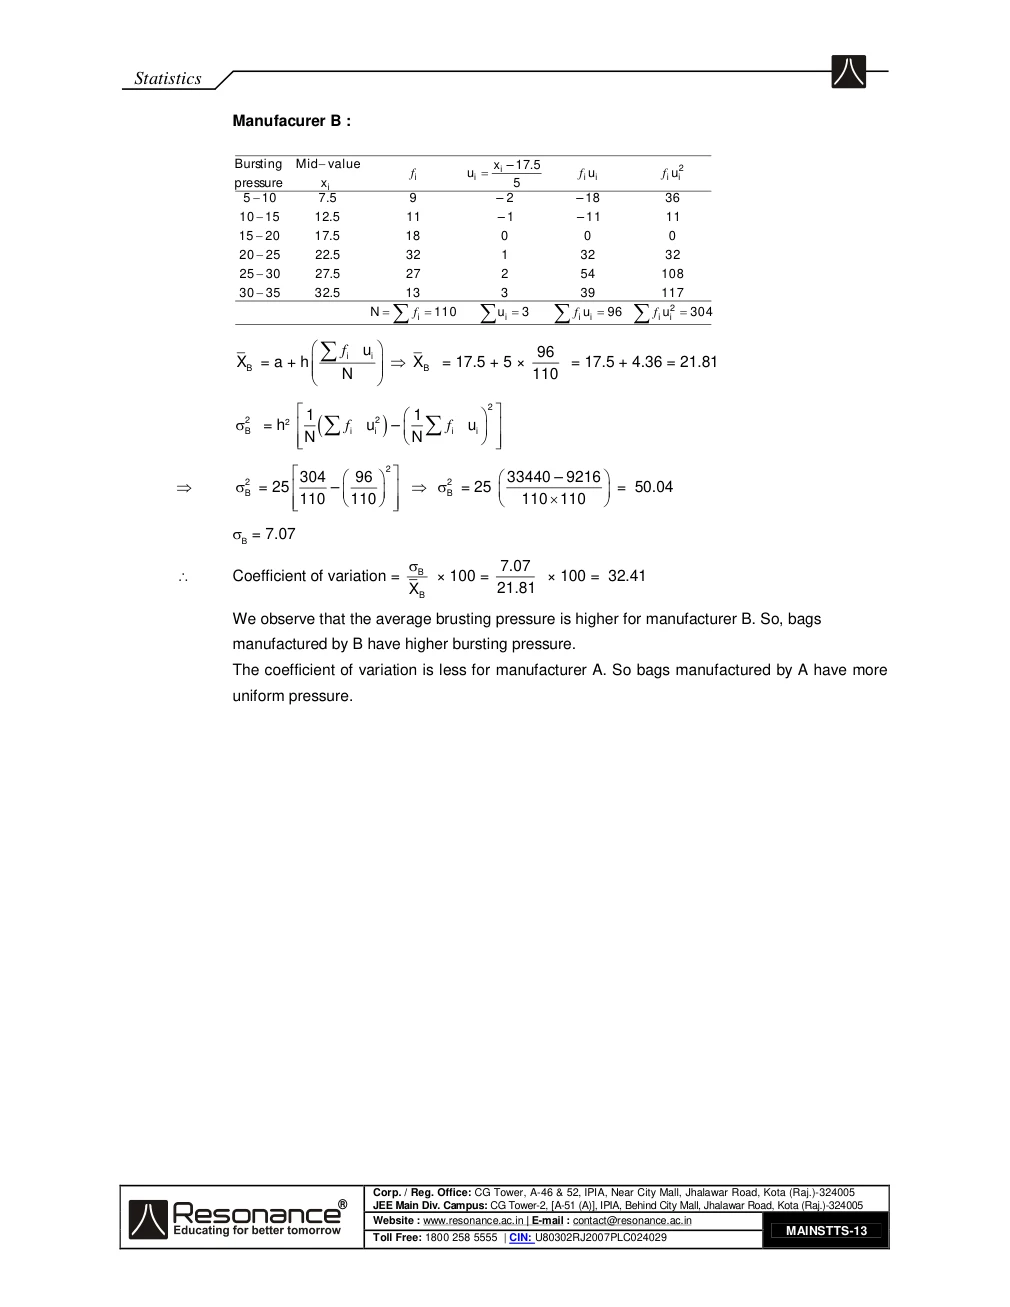
MAASStatistics
© MAAS. All rights reserved.Page 13 / 27
Extracted text · page 13
Statistics
Manufacurer B :
Bursting Mid value x i – 17. 5 2
f i u i f i u i f i u i
pressure x i 5
5 10 7 . 5 9 – 2 – 18 36
10 15 12. 5 11 – 1 – 11 11
15 20 17. 5 18 0 0 0
20 25 22. 5 32 1 32 32
25 30 27. 5 27 2 54 108
30 35 32. 5 13 3 39 117
N f i 110 u i 3 f i u i 96 f i u i2 304
f i iu 96 XB = a + h XB = 17.5 + 5 × = 17.5 + 4.36 = 21.81
N 110
2 1 2 1 2
B = h2 f i ui – f i ui
N N
2 304 96 2 2 33440 – 9216
B = 25 – B = 25 = 50.04
110 110 110 110
B = 7.07
B 7.07 Coefficient of variation = × 100 = × 100 = 32.41
XB 21.81
We observe that the average brusting pressure is higher for manufacturer B. So, bags
manufactured by B have higher bursting pressure.
The coefficient of variation is less for manufacturer A. So bags manufactured by A have more
uniform pressure.
MAINSTTS-13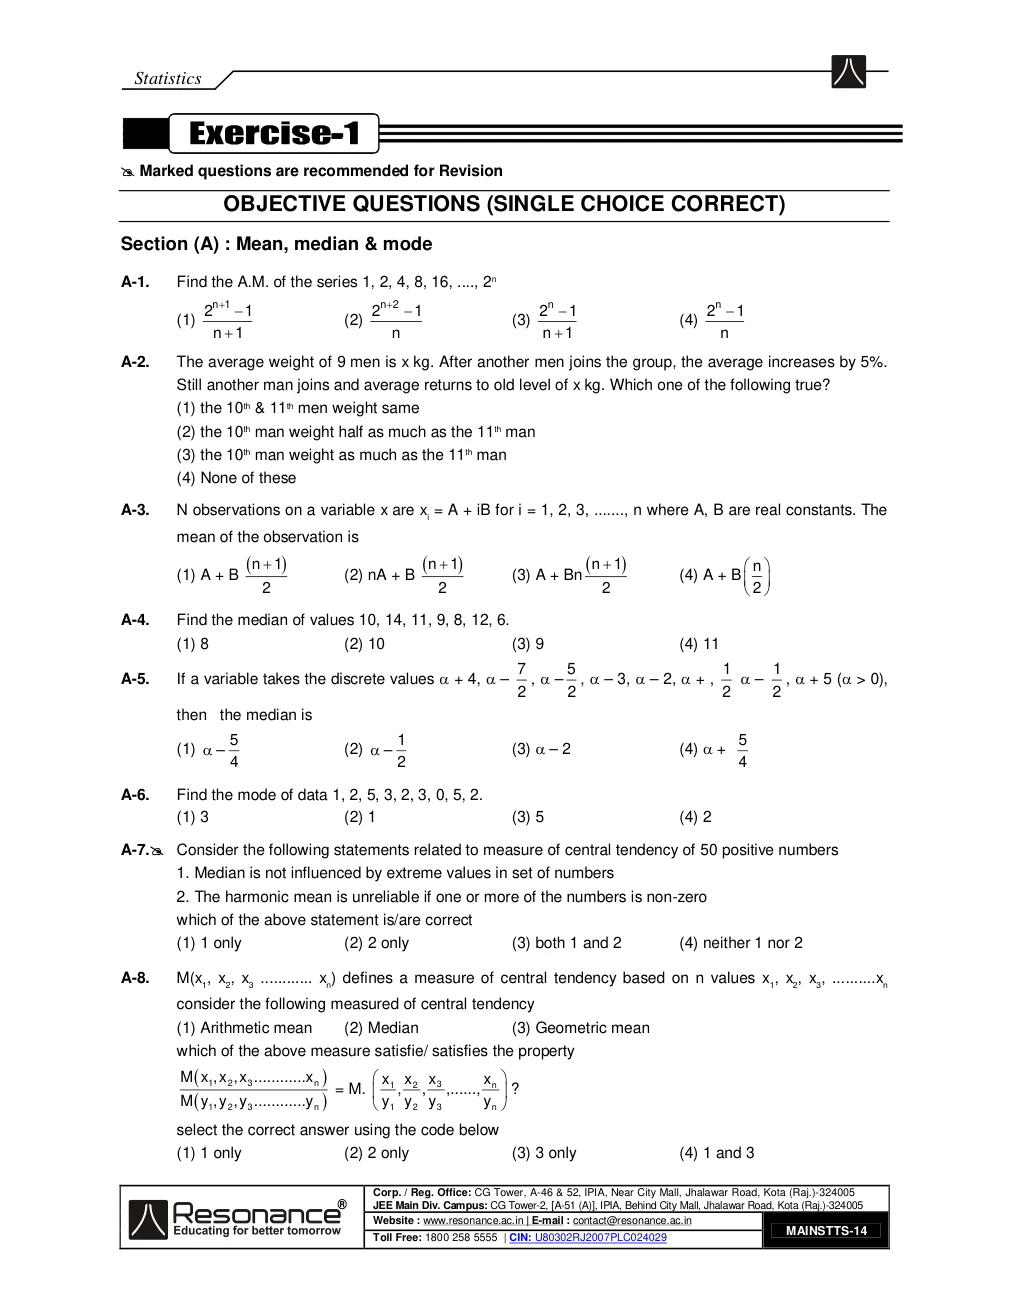
MAASStatistics
© MAAS. All rights reserved.Page 14 / 27
Extracted text · page 14
Statistics
Marked questions are recommended for Revision
OBJECTIVE QUESTIONS (SINGLE CHOICE CORRECT)
Section (A) : Mean, median & mode
A-1. Find the A.M. of the series 1, 2, 4, 8, 16, ...., 2n
2n 1 1 2n 2 1 2n 1 2n 1
(1) (2) (3) (4)
n 1 n n 1 n
A-2. The average weight of 9 men is x kg. After another men joins the group, the average increases by 5%.
Still another man joins and average returns to old level of x kg. Which one of the following true?
(1) the 10th & 11th men weight same
(2) the 10th man weight half as much as the 11th man
(3) the 10th man weight as much as the 11th man
(4) None of these
A-3. N observations on a variable x are xi = A + iB for i = 1, 2, 3, ......., n where A, B are real constants. The
mean of the observation is
n 1 n 1 n 1 n
(1) A + B (2) nA + B (3) A + Bn (4) A + B
2 2 2 2
A-4. Find the median of values 10, 14, 11, 9, 8, 12, 6.
(1) 8 (2) 10 (3) 9 (4) 11
7 5 1 1
A-5. If a variable takes the discrete values + 4, – , – , – 3, – 2, + , – , + 5 ( > 0),
2 2 2 2
then the median is
5 1 5
(1) – (2) – (3) – 2 (4) +
4 2 4
A-6. Find the mode of data 1, 2, 5, 3, 2, 3, 0, 5, 2.
(1) 3 (2) 1 (3) 5 (4) 2
A-7. Consider the following statements related to measure of central tendency of 50 positive numbers
1. Median is not influenced by extreme values in set of numbers
2. The harmonic mean is unreliable if one or more of the numbers is non-zero
which of the above statement is/are correct
(1) 1 only (2) 2 only (3) both 1 and 2 (4) neither 1 nor 2
A-8. M(x1, x2, x3 ............ xn) defines a measure of central tendency based on n values x1, x2, x3, ..........xn
consider the following measured of central tendency
(1) Arithmetic mean (2) Median (3) Geometric mean
which of the above measure satisfie/ satisfies the property
M x1,x 2 ,x 3 ............x n x 1 x 2 x 3 x n
= M. , , ,......, ?
M y1,y 2 ,y 3 ............y n y 1 y 2 y 3 y n
select the correct answer using the code below
(1) 1 only (2) 2 only (3) 3 only (4) 1 and 3
MAINSTTS-14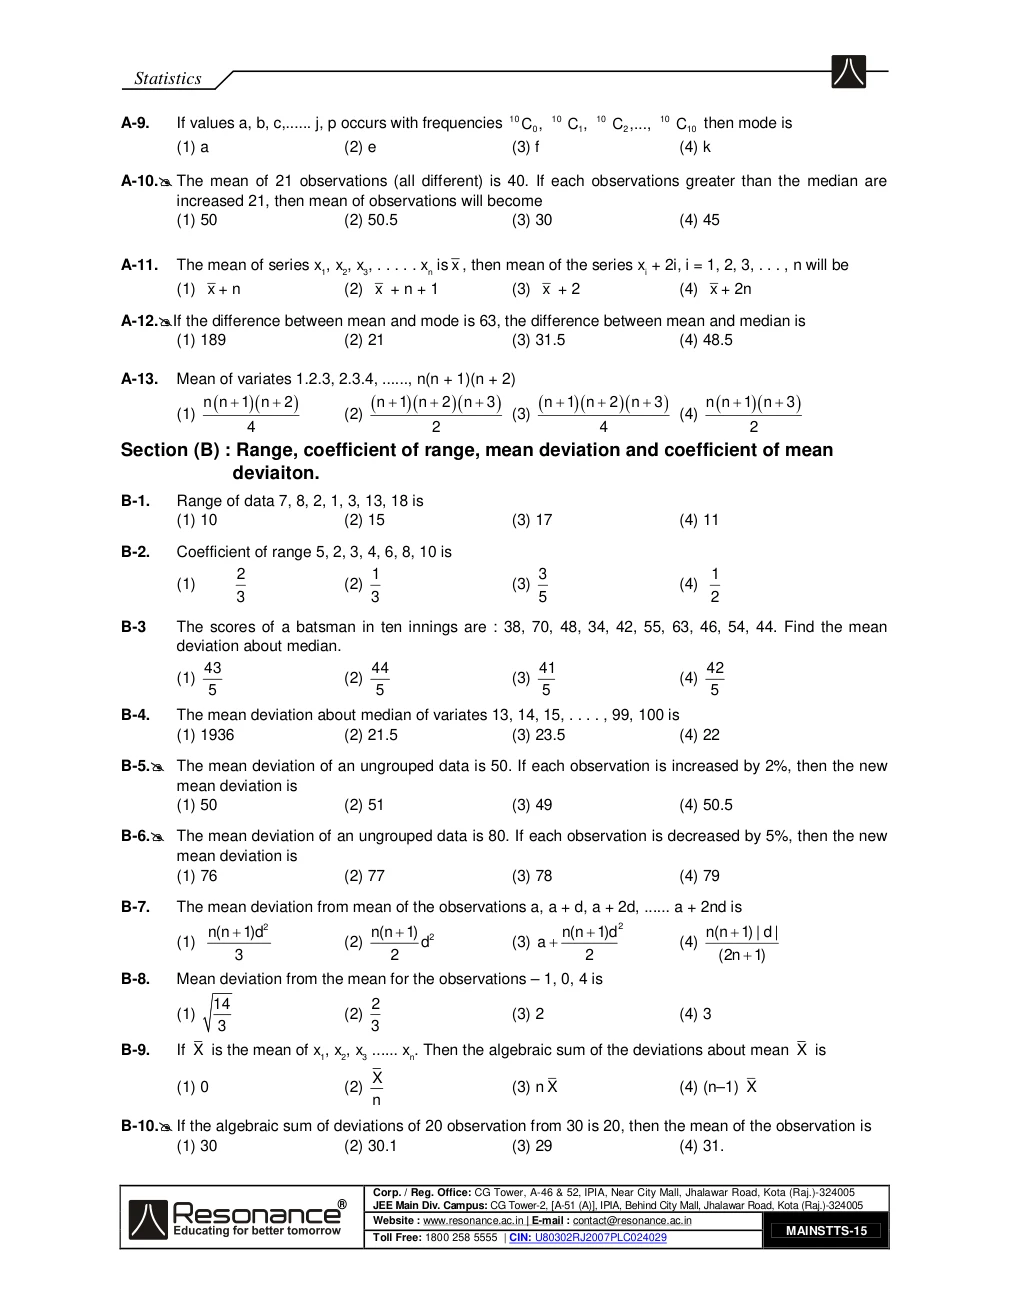
MAASStatistics
© MAAS. All rights reserved.Page 15 / 27
Extracted text · page 15
Statistics
A-9. If values a, b, c,...... j, p occurs with frequencies 10 C 0 , 10 C1 , 10 C 2 ,..., 10 C10 then mode is
(1) a (2) e (3) f (4) k
A-10. The mean of 21 observations (all different) is 40. If each observations greater than the median are
increased 21, then mean of observations will become
(1) 50 (2) 50.5 (3) 30 (4) 45
A-11. The mean of series x1, x2, x3, . . . . . xn is x , then mean of the series xi + 2i, i = 1, 2, 3, . . . , n will be
(1) x + n (2) x + n + 1 (3) x + 2 (4) x + 2n
A-12.If the difference between mean and mode is 63, the difference between mean and median is
(1) 189 (2) 21 (3) 31.5 (4) 48.5
A-13. Mean of variates 1.2.3, 2.3.4, ......, n(n + 1)(n + 2)
n n 1 n 2 n 1 n 2 n 3 n 1 n 2 n 3 n n 1 n 3
(1) (2) (3) (4)
4 2 4 2
Section (B) : Range, coefficient of range, mean deviation and coefficient of mean
deviaiton.
B-1. Range of data 7, 8, 2, 1, 3, 13, 18 is
(1) 10 (2) 15 (3) 17 (4) 11
B-2. Coefficient of range 5, 2, 3, 4, 6, 8, 10 is
2 1 3 1
(1) (2) (3) (4)
3 3 5 2
B-3 The scores of a batsman in ten innings are : 38, 70, 48, 34, 42, 55, 63, 46, 54, 44. Find the mean
deviation about median.
43 44 41 42
(1) (2) (3) (4)
5 5 5 5
B-4. The mean deviation about median of variates 13, 14, 15, . . . . , 99, 100 is
(1) 1936 (2) 21.5 (3) 23.5 (4) 22
B-5. The mean deviation of an ungrouped data is 50. If each observation is increased by 2%, then the new
mean deviation is
(1) 50 (2) 51 (3) 49 (4) 50.5
B-6. The mean deviation of an ungrouped data is 80. If each observation is decreased by 5%, then the new
mean deviation is
(1) 76 (2) 77 (3) 78 (4) 79
B-7. The mean deviation from mean of the observations a, a + d, a + 2d, ...... a + 2nd is
n(n 1)d2 n(n 1) 2 n(n 1)d 2 n(n 1) | d |
(1) (2) d (3) a (4)
3 2 2 (2n 1)
B-8. Mean deviation from the mean for the observations – 1, 0, 4 is
14 2
(1) (2) (3) 2 (4) 3
3 3
B-9. If X is the mean of x1, x2, x3 ...... xn. Then the algebraic sum of the deviations about mean X is
X
(1) 0 (2) (3) n X (4) (n–1) X
n
B-10. If the algebraic sum of deviations of 20 observation from 30 is 20, then the mean of the observation is
(1) 30 (2) 30.1 (3) 29 (4) 31.
MAINSTTS-15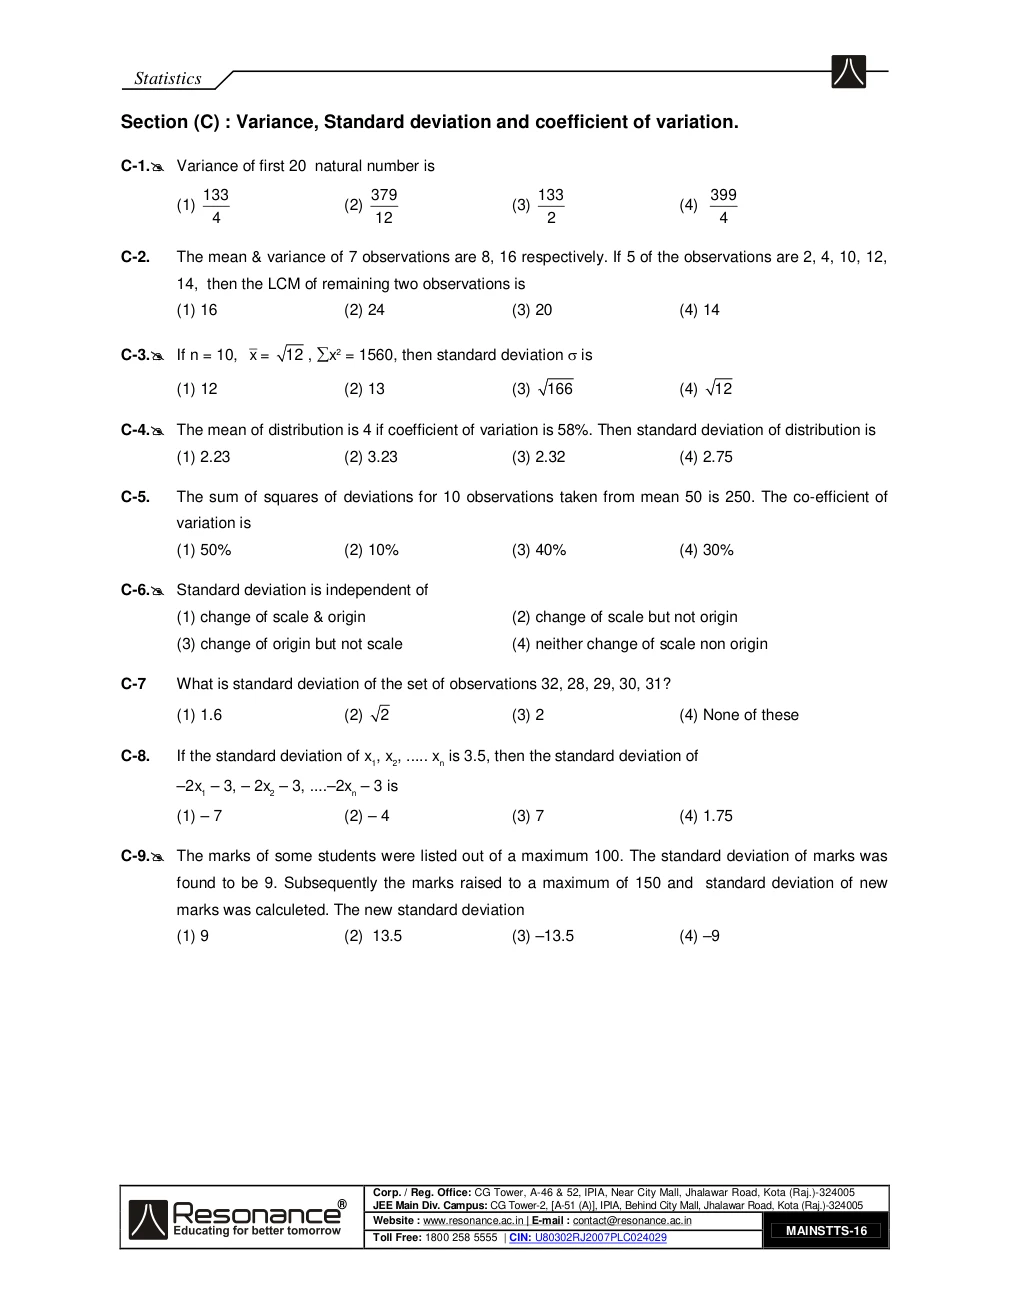
MAASStatistics
© MAAS. All rights reserved.Page 16 / 27
Extracted text · page 16
Statistics
Section (C) : Variance, Standard deviation and coefficient of variation.
C-1. Variance of first 20 natural number is
133 379 133 399
(1) (2) (3) (4)
4 12 2 4
C-2. The mean & variance of 7 observations are 8, 16 respectively. If 5 of the observations are 2, 4, 10, 12,
14, then the LCM of remaining two observations is
(1) 16 (2) 24 (3) 20 (4) 14
C-3. If n = 10, x = 12 , x2 = 1560, then standard deviation is
(1) 12 (2) 13 (3) 166 (4) 12
C-4. The mean of distribution is 4 if coefficient of variation is 58%. Then standard deviation of distribution is
(1) 2.23 (2) 3.23 (3) 2.32 (4) 2.75
C-5. The sum of squares of deviations for 10 observations taken from mean 50 is 250. The co-efficient of
variation is
(1) 50% (2) 10% (3) 40% (4) 30%
C-6. Standard deviation is independent of
(1) change of scale & origin (2) change of scale but not origin
(3) change of origin but not scale (4) neither change of scale non origin
C-7 What is standard deviation of the set of observations 32, 28, 29, 30, 31?
(1) 1.6 (2) 2 (3) 2 (4) None of these
C-8. If the standard deviation of x1, x2, ..... xn is 3.5, then the standard deviation of
–2x1 – 3, – 2x2 – 3, ....–2xn – 3 is
(1) – 7 (2) – 4 (3) 7 (4) 1.75
C-9. The marks of some students were listed out of a maximum 100. The standard deviation of marks was
found to be 9. Subsequently the marks raised to a maximum of 150 and standard deviation of new
marks was calculeted. The new standard deviation
(1) 9 (2) 13.5 (3) –13.5 (4) –9
MAINSTTS-16
MAASStatistics
© MAAS. All rights reserved.Page 17 / 27
Extracted text · page 17
Statistics
Marked questions are recommended for Revision
PART - I : OBJECTIVE QUESTIONS (SINGLE CHOICE CORRECT)
1. Find the arithmetic mean of 2n+1C0 , 2n+1C1 , .......2n+1Cn .
22n 2 2 2n 2n 1
(1) (2) (3) (4) None of these
n n 1 n 1
2. A variable takes the values of 0, 1, 2, . . . . . , n with frequencies proportional to the binomial coefficients
nC0, nC1, nC2, . . . . , nCn, then mean of the distribution is
n n 1 n n n – 1 n n 1
(1) (2) (3) (4)
4 2 2 2
3. Following is the record of goals scored by team A in football session
Numbers of goals scored 0 1 2 3 4
Numbers of match is 1 9 7 5 3
for team ‘B’ mean number of goals scored per match was 2 goals with standard deviation 1.25 . The
team which is more consistant
(1) A (2) B
(3) A & B both are equal (4) neither A nor B
4. The mean of two samples of sizes 200 and 300 were found to be 25, 10 respectively. Their
standarddeviations were 3 and 4 respectively. Find the variance of combined sample of size 500
(1) 70 (2) 60 (3) 67.2 (4) 80
5. The first of the two samples has 100 items with mean 15 and S.D. 3. If the whole group has 250 items
with mean 15.6 and S.D. = 13.44 then S.D. of the second group is
(1) 5 (2) 4 (3) 6 (4) 3.52
6. The average marks of 10 students in a class was 60 with standard deviation 4. While the average
marks of other 10 students was 40 with a standard deviation 6. If all the 20 students are taken together,
their standard deviation will be
(1) 5.0 (2) 7.5 (3) 9.8 (4) 11.2
7. The mean and variance of 5 observations of an experiment are 4 and 5.2 respectively. From these
observations three are 1, 2 and 6 and = |x1 – x2| + 8 where x1 & x2 are remaining observations. Then
number of solution of equation 10 – x2 – 2x = are
(1) 1 (2) 2 (3) 3 (4) 4
8. The mean and variance of 10 numbers were calculated as 11.3 and 3.3 respectively. It was
subsequently found that one of the a number was misread as 10 instead of 12. How does the variance
change.
(1) variance decreases (2) variance increases
(3) nothing can be said about variance (4) variance remains unchanged.
MAINSTTS-17
MAASStatistics
© MAAS. All rights reserved.Page 18 / 27
Extracted text · page 18
Statistics
Comprehension # 1_ (Q. No. 9 to 11)
As median divides an arranged series into two equal parts, in similar way quartile divides an arranged
series in 4 equal part. For ungrouped frequency distribution formula of finding ith quartile =
th
N 1
Qi = i . term, i = 1, 2, 3.
4
Quartile deviation : half of difference between upper quartile & lower quartile.
1 Q 3 – Q1
Quartile deviation (Q.D.) = (Q3 – Q1) Coefficient of quartile deviation = .
2 Q 3 Q1
9. If 1, 2, 3, 4, 5, 6, 7, are numbers then Q1 & Q3 are respectively
(1) 2, 4 (2) 2, 6 (3) 4, 6 (4) 3, 5
10. Quartile deviation of the following numbers 10, 8, 12, 11, 14, 9, 6 is
(1) 2 (2) 10 (3) 1/2 (4) 1
11. Coefficient of quartile deviation of numbers 6, 8, 9, 10, 11, 12, 14 is
(1) 1/5 (2) 1/10 (3) 2/5 (4) 1/4
Comprehension # 2 (Q. No. 12 to 14)
To analyse data using mean, median and mode, we need to use the most appropriate measure of
central tendency. The mean is useful for predicting future results when there are no extreme values in
the data set. The median may be more useful than the mean when there are extreme values in the data
set as it is not affected by the extreme values. The median is most commonly quoted figure used to
measure property prices as mean property price is affected by a few expensive properties that are not
representative of the general property market. The mode is useful when the most common item or
characteristic of a data set is required. The mode has applications in printing. It is important to print
more of the most popular books.
12. For the data shown, the value of appropriate measure of central tendency is
No.of staff 1 2 4 5 3 2
Salary
15000 10000 7000 12000 90000 95000
(In rupees)
(1) 95000 (2) 18350 (3) 90000 (4) 12000
13. For a normally distributed sample as shown, then most appropriate representative of data is
f
20
Student 15
of 10
Number 5
x
0 2 4 6 8 10
Number of marks
(1) Mean (2) Mode
(3) Median (4) any one of mean or median
14. Based upon collection of data of numbers of days it snows, rains or it is sunny in a month for three
month December, January and February of last year, the weather forecast points that snow is likely to
be in January. Which measure is used for this forecast ?
(1) Mean (2) Mode (3) Median (4) Range
MAINSTTS-18
MAASStatistics
© MAAS. All rights reserved.Page 19 / 27
Extracted text · page 19
Statistics
PART - II : MISCELLANEOUS QUESTIONS
Section (A) : ASSERTION/REASONING
DIRECTIONS :
Each question has 4 choices (1), (2), (3) and (4) out of which ONLY ONE is correct.
(1) Both the statements are true.
(2) Statement- is true, but Statement- is false.
(3) Statement- is false, but Statement- is true.
(4) Both the statements are false.
9 9
A-1. Statement-1 : If (x i 8) = 9 and (x i 8) 2 = 45 then S.D. of x1, x2,......, x9 is 2.
i 1 i 1
Statement-2 : S.D. is independent of change of origin.
A-2. Statement-1 : Mean cannot be represented graphically.
Statement-2 : Mean may not coincide with anyone of the actual values.
Section (B) : MATCH THE COLUMN
B-1 Column - I Column - II
(1) Better measure of central tendency for data 1, 7, 8, 9, 9 is (p) Mean
(2) Which is not independent of change of scale ? (q) Median
(3) Which is not dependent on change of origin ? (r) Mode
(4) The value of range of data is always greater than or equal to (s) S.D.
B-2 Let n N.
Column I Column II
(1) S.D. of 2, 4, 6, ..... 2n ; n N (p) n
n 1
(2) S.D. of 1, 3, 5, ....., 2n – 1 ; n N (q)
2
n 2 – 1
(3) Mean of 1,3,5, .....2n–1 ; n N (r)
3
n 2 – 1
(4) Median of 1,3,5,.....,2n – 1 (s)
12
MAINSTTS-19
MAASStatistics
© MAAS. All rights reserved.Page 20 / 27
Extracted text · page 20
Statistics
Section (C) : ONE OR MORE THAN ONE OPTIONS CORRECT
C-1. If the daily earnings (in rupees) of 12 workers in a factory are 16, 11, 3, 7, 5, 28, 9, 31, 28, 43, 15 ,17,
then which of the following is(are) true
(1) mean = 17.75 (2) median = 15.5
(3) mode = 28 (4) mean deviation about mean = 9.8 3
C-2 If first sample of 25 variates has the mean 40 and standard deviation 5 and a second sample of 35
variates has the mean 45 and standard deviation 2, then which of the following is/are true
(1) mean of combined sample space = 42.917
(2) mean of combined sample space = 32.9
(3) standard deviation of combined sample space = 3.34
(4) standard deviation of combined sample space = 4.34
C-3. Which of the following is false :
(1) Algebraic sum of deviations of observation from their mean is zero
(2) If S.D. of xi(i = 1, 2, 3, . . . . . n) is then S.D. of hxi is h
(3) Median is severely affected by fluctuations in extreme values
(4) Mean deviations of a given set of observations is least when taken about their median.
Marked questions are recommended for Revision
* Marked Questions may have more than one correct option.
PART - I : JEE (MAIN) / AIEEE PROBLEMS (PREVIOUS YEARS)
1. The mean of the number a, b, 8, 5, 10 is 6 and the variance is 6.80. Then which one of the folowing
gives possible values of a and b ? [AIEEE 2008, (3, –1), 105]
(1) a = 3, b = 4 (2) a = 0, b = 7 (3) a = 5, b = 2 (4) a = 1, b = 6
n 2 – 1
2. Statement-I The variance of first n even natural numbers is [AIEEE 2009, (4, –1), 144]
4
n(n 1)
Statement-II The sum of first n natural numbers is and the sum of squares of first n natural
2
n(n 1)(2n 1)
numbers is .
6
(1) Statement-1 is True, Statement-2 is True; Statement-2 is a correct explanation for Statement-1.
(2) Statement-1 is True, Statement-2 is True; Statement-2 is NOT a correct explanation for Statement-1
(3) Statement-1 is True, Statement-2 is False
(4) Statement-1 is False, Statement-2 is True
3. If the mean deviation of numbers 1, 1 + d, 1 + 2d, .....,1 + 100d from their mean is 255, then the value
of d is equal to- [AIEEE 2009, (4, –1), 144]
(1) 10.0 (2) 20.0 (3) 10.1 (4) 20.2
4. For two data sets, each of size 5, the variance are given to be 4 and 5 and the corresponding means
are given to be 2 and 4, respectively. The variance of the combined data set is
[AIEEE 2010, (4, –1), 144
11 13 5
(1) (2) 6 (3) (4)
2 2 2
MAINSTTS-20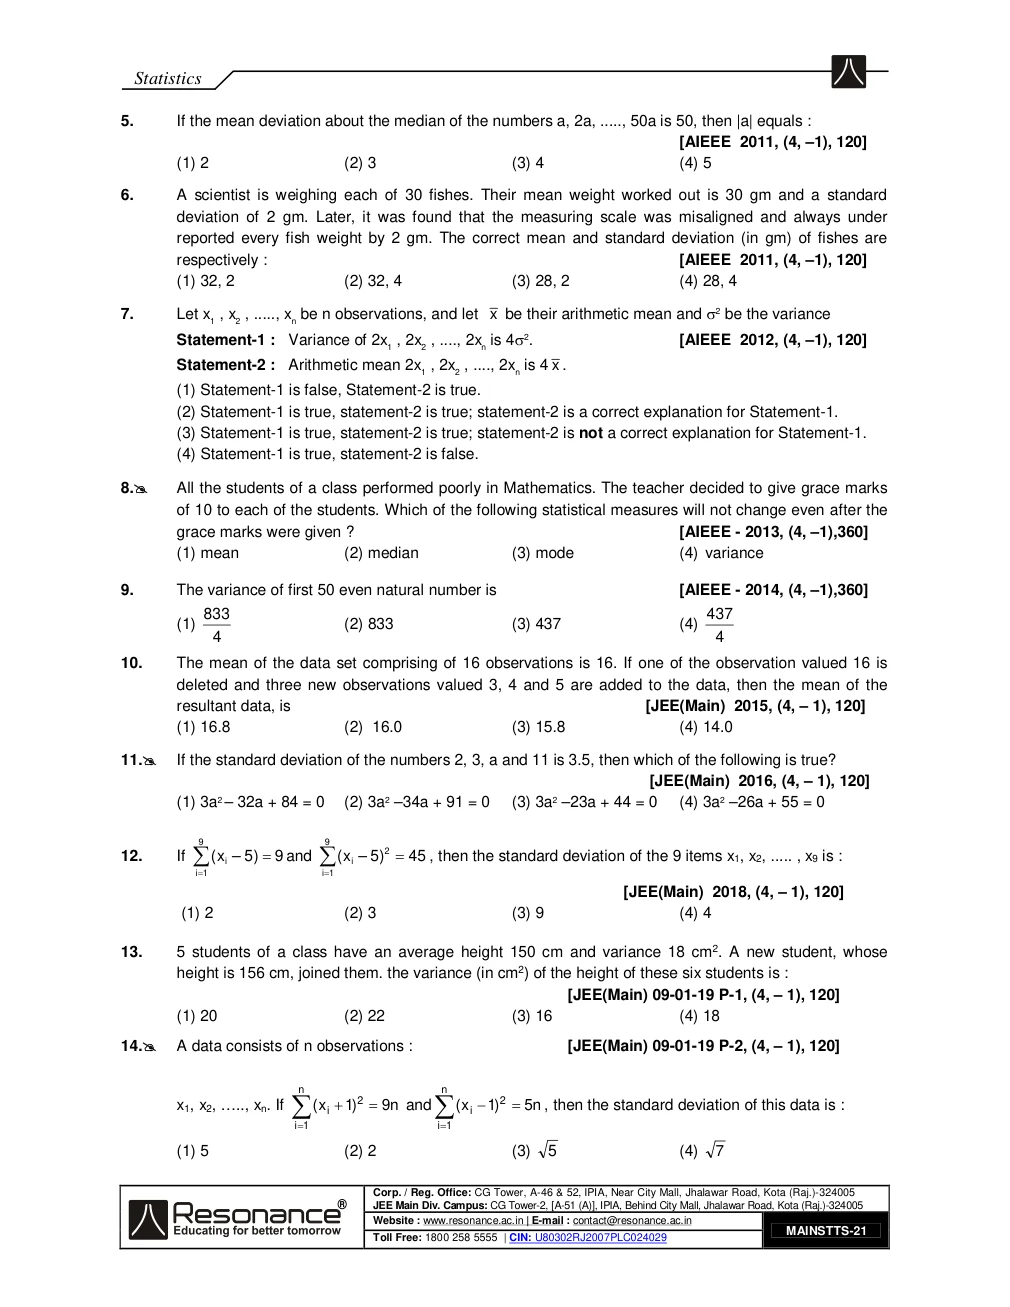
MAASStatistics
© MAAS. All rights reserved.Page 21 / 27
Extracted text · page 21
Statistics
5. If the mean deviation about the median of the numbers a, 2a, ....., 50a is 50, then |a| equals :
[AIEEE 2011, (4, –1), 120]
(1) 2 (2) 3 (3) 4 (4) 5
6. A scientist is weighing each of 30 fishes. Their mean weight worked out is 30 gm and a standard
deviation of 2 gm. Later, it was found that the measuring scale was misaligned and always under
reported every fish weight by 2 gm. The correct mean and standard deviation (in gm) of fishes are
respectively : [AIEEE 2011, (4, –1), 120]
(1) 32, 2 (2) 32, 4 (3) 28, 2 (4) 28, 4
7. Let x1 , x2 , ....., xn be n observations, and let x be their arithmetic mean and 2 be the variance
Statement-1 : Variance of 2x1 , 2x2 , ...., 2xn is 42. [AIEEE 2012, (4, –1), 120]
Statement-2 : Arithmetic mean 2x1 , 2x2 , ...., 2xn is 4 x .
(1) Statement-1 is false, Statement-2 is true.
(2) Statement-1 is true, statement-2 is true; statement-2 is a correct explanation for Statement-1.
(3) Statement-1 is true, statement-2 is true; statement-2 is not a correct explanation for Statement-1.
(4) Statement-1 is true, statement-2 is false.
8. All the students of a class performed poorly in Mathematics. The teacher decided to give grace marks
of 10 to each of the students. Which of the following statistical measures will not change even after the
grace marks were given ? [AIEEE - 2013, (4, –1),360]
(1) mean (2) median (3) mode (4) variance
9. The variance of first 50 even natural number is [AIEEE - 2014, (4, –1),360]
833 437
(1) (2) 833 (3) 437 (4)
4 4
10. The mean of the data set comprising of 16 observations is 16. If one of the observation valued 16 is
deleted and three new observations valued 3, 4 and 5 are added to the data, then the mean of the
resultant data, is [JEE(Main) 2015, (4, – 1), 120]
(1) 16.8 (2) 16.0 (3) 15.8 (4) 14.0
11. If the standard deviation of the numbers 2, 3, a and 11 is 3.5, then which of the following is true?
[JEE(Main) 2016, (4, – 1), 120]
(1) 3a2 – 32a + 84 = 0 (2) 3a2 –34a + 91 = 0 (3) 3a2 –23a + 44 = 0 (4) 3a2 –26a + 55 = 0
9 9
12. If (x i – 5) 9 and (x i – 5)2 45 , then the standard deviation of the 9 items x1, x2, ..... , x9 is :
i 1 i 1
[JEE(Main) 2018, (4, – 1), 120]
(1) 2 (2) 3 (3) 9 (4) 4
13. 5 students of a class have an average height 150 cm and variance 18 cm2. A new student, whose
height is 156 cm, joined them. the variance (in cm2) of the height of these six students is :
[JEE(Main) 09-01-19 P-1, (4, – 1), 120]
(1) 20 (2) 22 (3) 16 (4) 18
14. A data consists of n observations : [JEE(Main) 09-01-19 P-2, (4, – 1), 120]
n n
i )1 2 5n , then the standard deviation of this data is : x1, x2, ….., xn. If ( x i )1 2 9n and ( x
i 1 i 1
(1) 5 (2) 2 (3) 5 (4) 7
MAINSTTS-21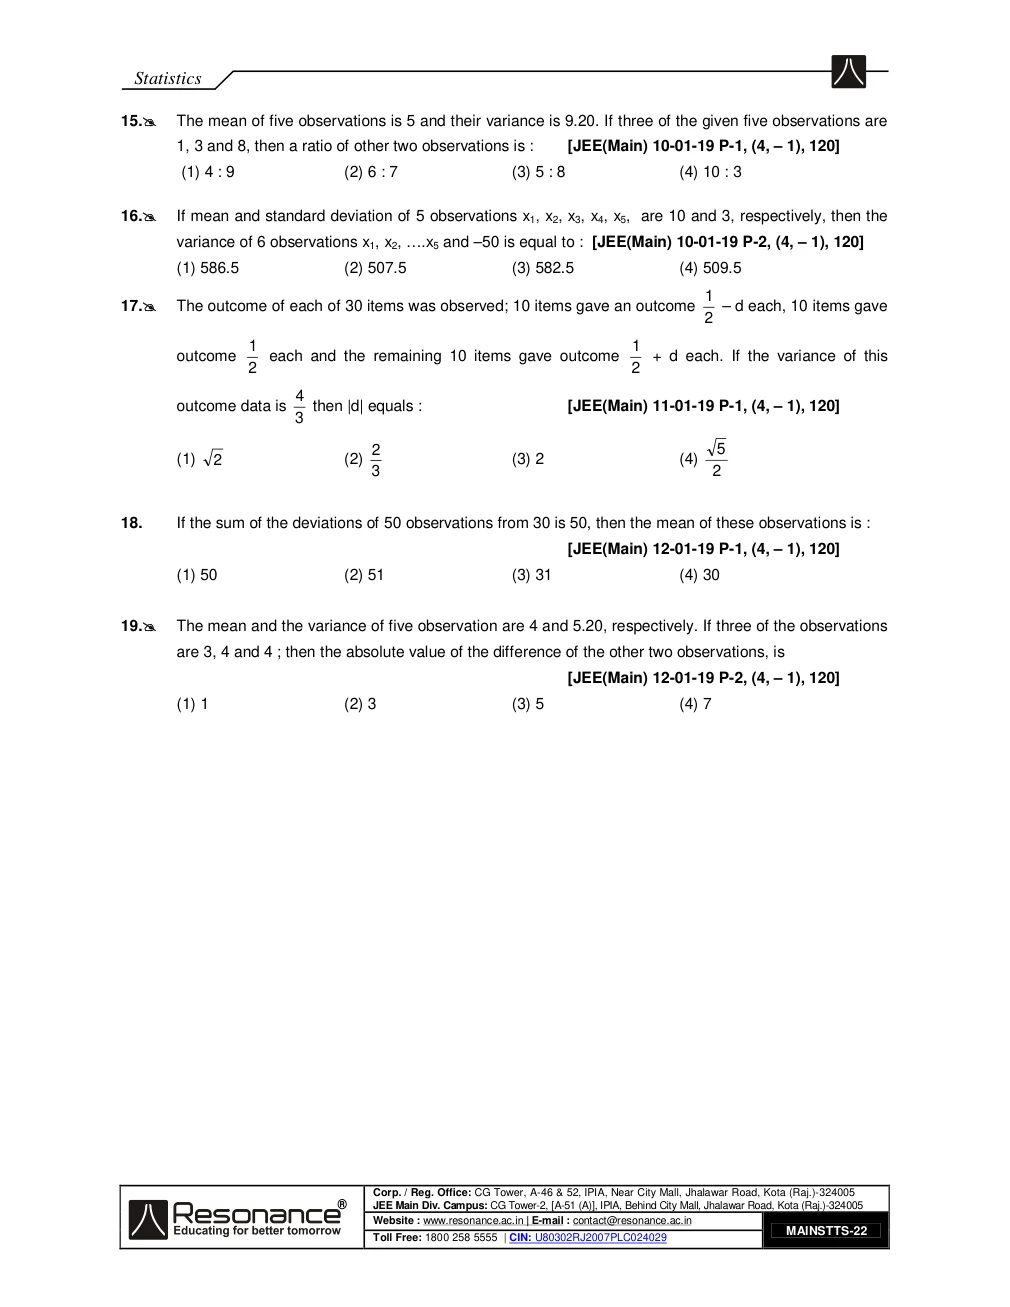
MAASStatistics
© MAAS. All rights reserved.Page 22 / 27
Extracted text · page 22
Statistics
15. The mean of five observations is 5 and their variance is 9.20. If three of the given five observations are
1, 3 and 8, then a ratio of other two observations is : [JEE(Main) 10-01-19 P-1, (4, – 1), 120]
(1) 4 : 9 (2) 6 : 7 (3) 5 : 8 (4) 10 : 3
16. If mean and standard deviation of 5 observations x1, x2, x3, x4, x5, are 10 and 3, respectively, then the
variance of 6 observations x1, x2, ….x5 and –50 is equal to : [JEE(Main) 10-01-19 P-2, (4, – 1), 120]
(1) 586.5 (2) 507.5 (3) 582.5 (4) 509.5
1
17. The outcome of each of 30 items was observed; 10 items gave an outcome – d each, 10 items gave
2
1 1
outcome each and the remaining 10 items gave outcome + d each. If the variance of this
2 2
4
outcome data is then |d| equals : [JEE(Main) 11-01-19 P-1, (4, – 1), 120]
3
2 5
(1) 2 (2) (3) 2 (4)
3 2
18. If the sum of the deviations of 50 observations from 30 is 50, then the mean of these observations is :
[JEE(Main) 12-01-19 P-1, (4, – 1), 120]
(1) 50 (2) 51 (3) 31 (4) 30
19. The mean and the variance of five observation are 4 and 5.20, respectively. If three of the observations
are 3, 4 and 4 ; then the absolute value of the difference of the other two observations, is
[JEE(Main) 12-01-19 P-2, (4, – 1), 120]
(1) 1 (2) 3 (3) 5 (4) 7
MAINSTTS-22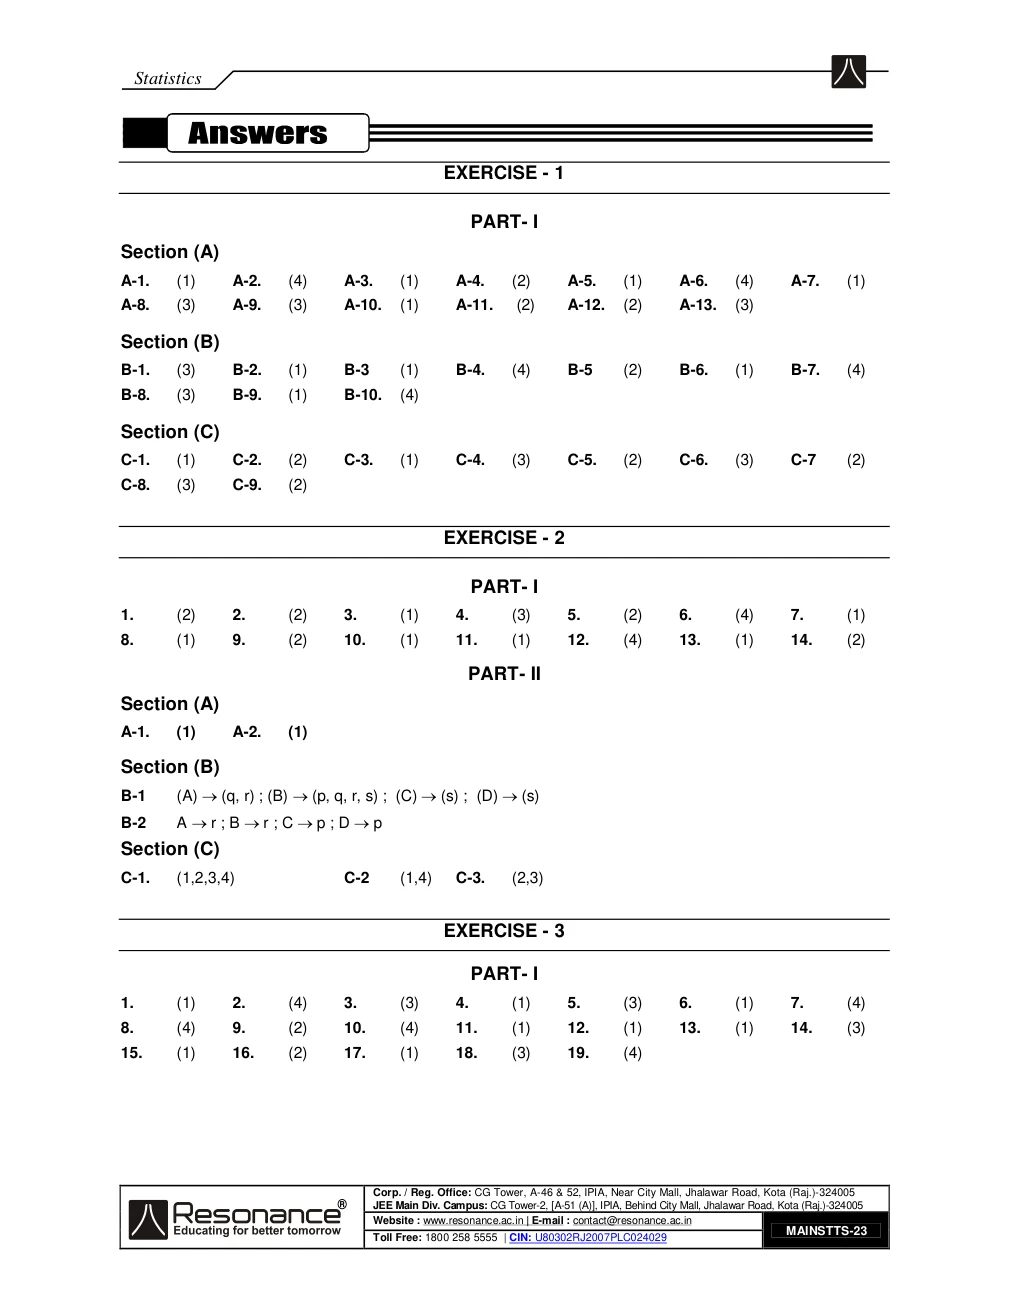
MAASStatistics
© MAAS. All rights reserved.Page 23 / 27
Extracted text · page 23
Statistics
EXERCISE - 1
PART- I
Section (A)
A-1. (1) A-2. (4) A-3. (1) A-4. (2) A-5. (1) A-6. (4) A-7. (1)
A-8. (3) A-9. (3) A-10. (1) A-11. (2) A-12. (2) A-13. (3)
Section (B)
B-1. (3) B-2. (1) B-3 (1) B-4. (4) B-5 (2) B-6. (1) B-7. (4)
B-8. (3) B-9. (1) B-10. (4)
Section (C)
C-1. (1) C-2. (2) C-3. (1) C-4. (3) C-5. (2) C-6. (3) C-7 (2)
C-8. (3) C-9. (2)
EXERCISE - 2
PART- I
1. (2) 2. (2) 3. (1) 4. (3) 5. (2) 6. (4) 7. (1)
8. (1) 9. (2) 10. (1) 11. (1) 12. (4) 13. (1) 14. (2)
PART- II
Section (A)
A-1. (1) A-2. (1)
Section (B)
B-1 (A) (q, r) ; (B) (p, q, r, s) ; (C) (s) ; (D) (s)
B-2 A r ; B r ; C p ; D p
Section (C)
C-1. (1,2,3,4) C-2 (1,4) C-3. (2,3)
EXERCISE - 3
PART- I
1. (1) 2. (4) 3. (3) 4. (1) 5. (3) 6. (1) 7. (4)
8. (4) 9. (2) 10. (4) 11. (1) 12. (1) 13. (1) 14. (3)
15. (1) 16. (2) 17. (1) 18. (3) 19. (4)
MAINSTTS-23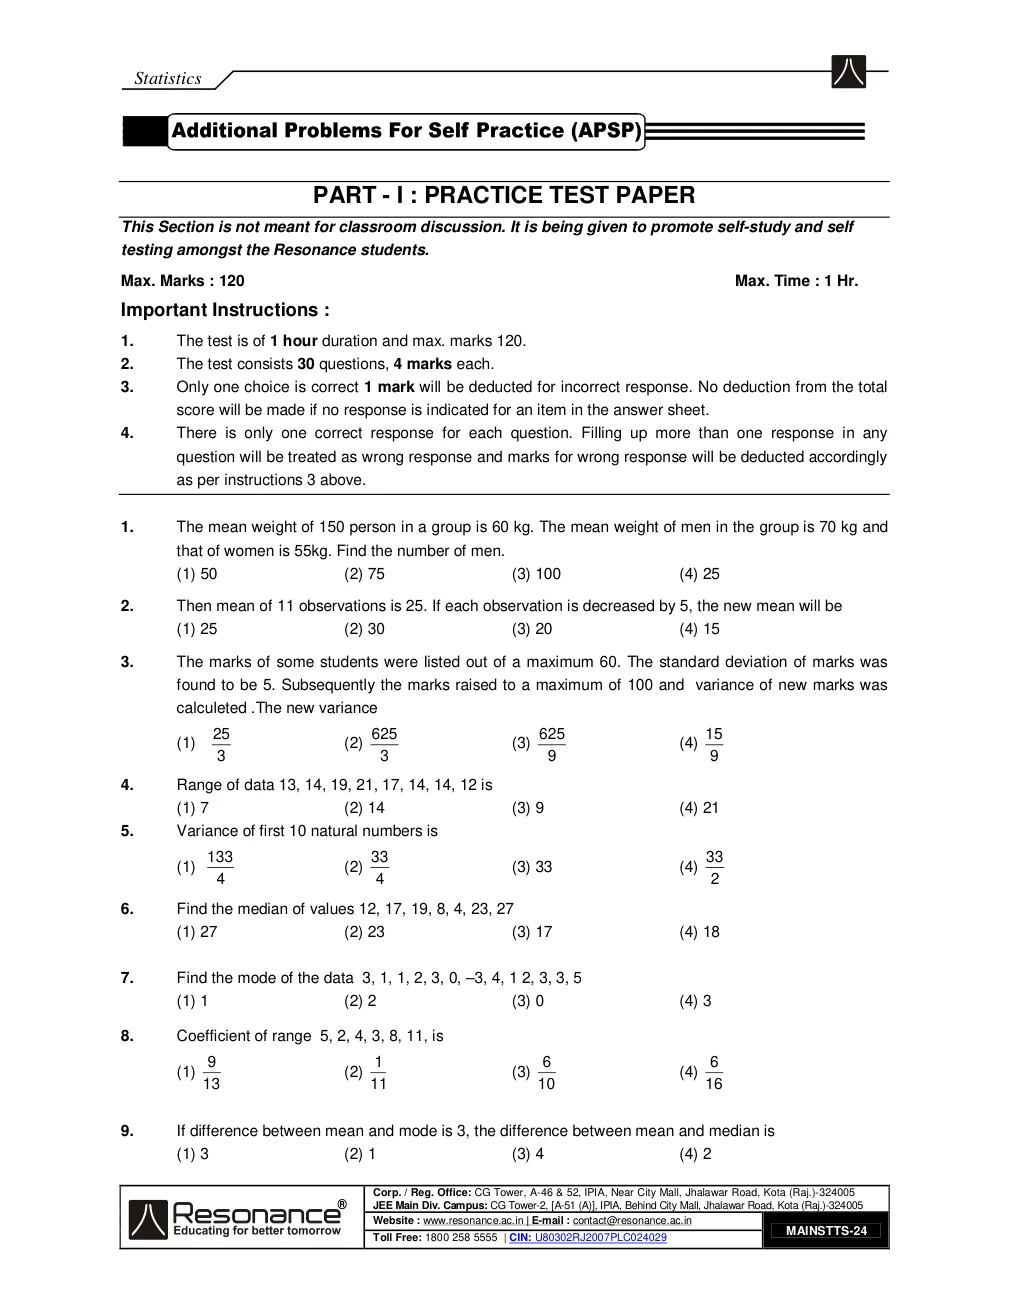
MAASStatistics
© MAAS. All rights reserved.Page 24 / 27
Extracted text · page 24
  Statistics


            PART - I : PRACTICE TEST PAPER

This Section is not meant for classroom discussion. It is being given to promote self-study and self

Max. Marks : 120                                                        Max. Time : 1 Hr.

Important Instructions :

1.     The test is of 1 hour duration and max. marks 120.
2.     The test consists 30 questions, 4 marks each.
3.     Only one choice is correct 1 mark will be deducted for incorrect response. No deduction from the total
       score will be made if no response is indicated for an item in the answer sheet.
4.     There is only one correct response for each question. Filling up more than one response in any
        question will be treated as wrong response and marks for wrong response will be deducted accordingly
       as per instructions 3 above.


1.     The mean weight of 150 person in a group is 60 kg. The mean weight of men in the group is 70 kg and
         that of women is 55kg. Find the number of men.
         (1) 50                    (2) 75                    (3) 100                   (4) 25

2.     Then mean of 11 observations is 25. If each observation is decreased by 5, the new mean will be
         (1) 25                    (2) 30                    (3) 20                    (4) 15

3.     The marks of some students were listed out of a maximum 60. The standard deviation of marks was
       found to be 5. Subsequently the marks raised to a maximum of 100 and  variance of new marks was
        calculeted .The new variance

           25                625                625                15
         (1)                       (2)                       (3)                       (4)
           3                  3                  9                  9

4.     Range of data 13, 14, 19, 21, 17, 14, 14, 12 is
         (1) 7                     (2) 14                    (3) 9                     (4) 21
5.      Variance of first 10 natural numbers is

          133                33                                     33
         (1)                       (2)                       (3) 33                    (4)
           4                 4                                      2

6.      Find the median of values 12, 17, 19, 8, 4, 23, 27
         (1) 27                    (2) 23                    (3) 17                    (4) 18


7.      Find the mode of the data 3, 1, 1, 2, 3, 0, –3, 4, 1 2, 3, 3, 5
         (1) 1                     (2) 2                     (3) 0                     (4) 3

8.      Coefficient of range 5, 2, 4, 3, 8, 11, is

          9                  1                  6                  6
         (1)                       (2)                       (3)                       (4)
         13                 11                 10                 16


9.          If difference between mean and mode is 3, the difference between mean and median is
         (1) 3                     (2) 1                     (3) 4                     (4) 2


                                                                                          MAINSTTS-24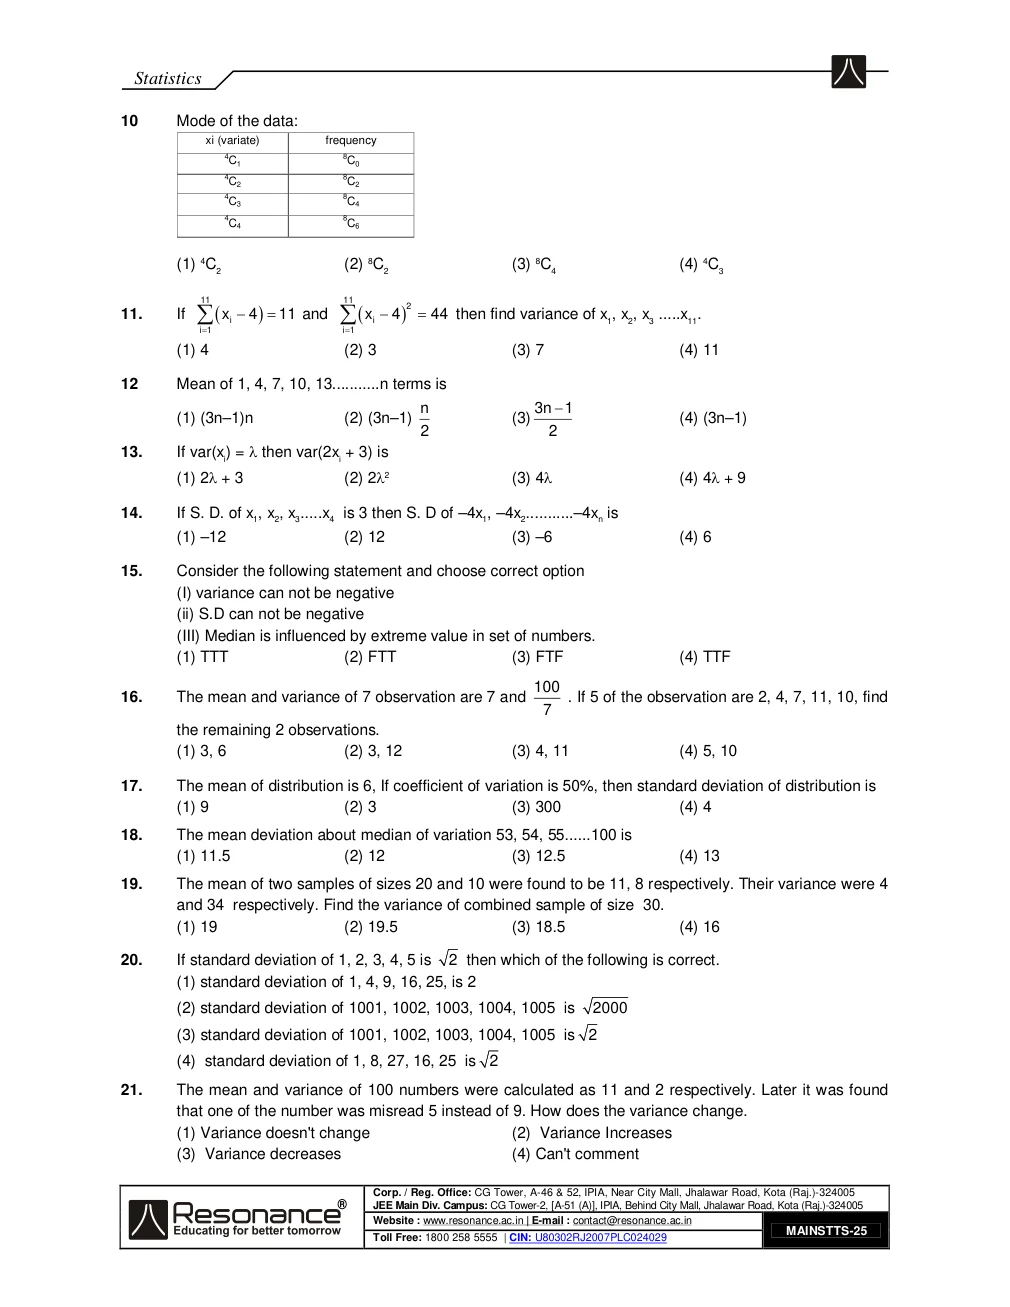
MAASStatistics
© MAAS. All rights reserved.Page 25 / 27
Extracted text · page 25
Statistics
10 Mode of the data:
xi (variate) frequency
4C1 8C0
4C2 8C2
4C3 8C4
4C4 8C6
(1) 4C2 (2) 8C2 (3) 8C4 (4) 4C3
11 11
11. If x i 4 11 and x i 4 2 44 then find variance of x1, x2, x3 .....x11.
i 1 i 1
(1) 4 (2) 3 (3) 7 (4) 11
12 Mean of 1, 4, 7, 10, 13...........n terms is
n 3n 1
(1) (3n–1)n (2) (3n–1) (3) (4) (3n–1)
2 2
13. If var(xi) = then var(2xi + 3) is
(1) 2 + 3 (2) 22 (3) 4 (4) 4 + 9
14. If S. D. of x1, x2, x3.....x4 is 3 then S. D of –4x1, –4x2...........–4xn is
(1) –12 (2) 12 (3) –6 (4) 6
15. Consider the following statement and choose correct option
(I) variance can not be negative
(ii) S.D can not be negative
(III) Median is influenced by extreme value in set of numbers.
(1) TTT (2) FTT (3) FTF (4) TTF
100
16. The mean and variance of 7 observation are 7 and . If 5 of the observation are 2, 4, 7, 11, 10, find
7
the remaining 2 observations.
(1) 3, 6 (2) 3, 12 (3) 4, 11 (4) 5, 10
17. The mean of distribution is 6, If coefficient of variation is 50%, then standard deviation of distribution is
(1) 9 (2) 3 (3) 300 (4) 4
18. The mean deviation about median of variation 53, 54, 55......100 is
(1) 11.5 (2) 12 (3) 12.5 (4) 13
19. The mean of two samples of sizes 20 and 10 were found to be 11, 8 respectively. Their variance were 4
and 34 respectively. Find the variance of combined sample of size 30.
(1) 19 (2) 19.5 (3) 18.5 (4) 16
20. If standard deviation of 1, 2, 3, 4, 5 is 2 then which of the following is correct.
(1) standard deviation of 1, 4, 9, 16, 25, is 2
(2) standard deviation of 1001, 1002, 1003, 1004, 1005 is 2000
(3) standard deviation of 1001, 1002, 1003, 1004, 1005 is 2
(4) standard deviation of 1, 8, 27, 16, 25 is 2
21. The mean and variance of 100 numbers were calculated as 11 and 2 respectively. Later it was found
that one of the number was misread 5 instead of 9. How does the variance change.
(1) Variance doesn't change (2) Variance Increases
(3) Variance decreases (4) Can't comment
MAINSTTS-25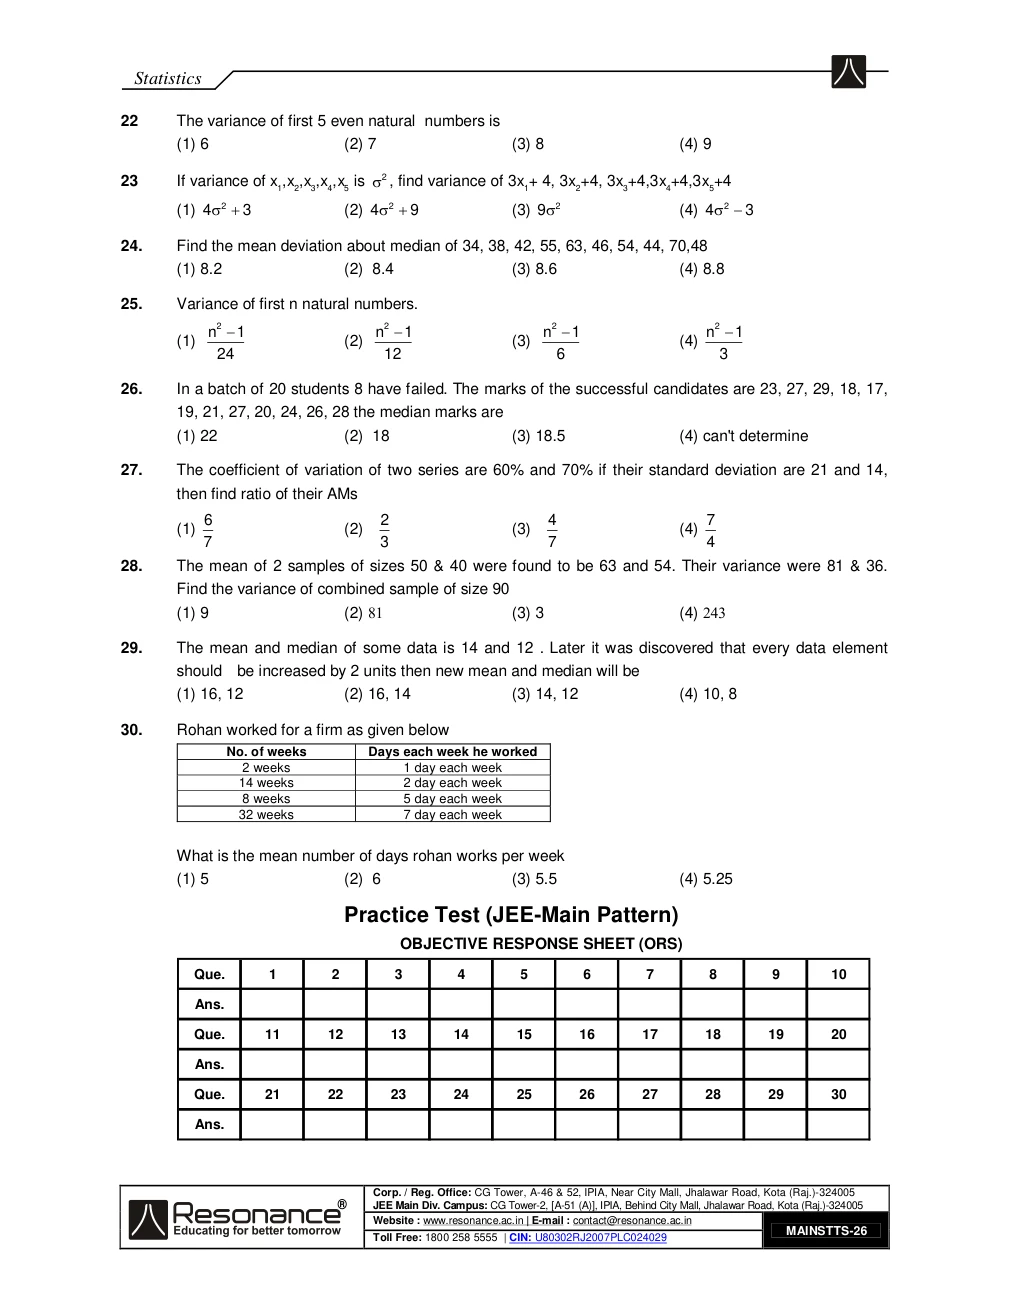
MAASStatistics
© MAAS. All rights reserved.Page 26 / 27
Extracted text · page 26
Statistics
22 The variance of first 5 even natural numbers is
(1) 6 (2) 7 (3) 8 (4) 9
23 If variance of x1,x2,x3,x4,x5 is ,2 find variance of 3x1+ 4, 3x2+4, 3x3+4,3x4+4,3x5+4
(1) 4 2 3 (2) 4 2 9 (3) 9 2 (4) 4 2 3
24. Find the mean deviation about median of 34, 38, 42, 55, 63, 46, 54, 44, 70,48
(1) 8.2 (2) 8.4 (3) 8.6 (4) 8.8
25. Variance of first n natural numbers.
n 2 1 n 2 1 n 2 1 n 2 1
(1) (2) (3) (4)
24 12 6 3
26. In a batch of 20 students 8 have failed. The marks of the successful candidates are 23, 27, 29, 18, 17,
19, 21, 27, 20, 24, 26, 28 the median marks are
(1) 22 (2) 18 (3) 18.5 (4) can't determine
27. The coefficient of variation of two series are 60% and 70% if their standard deviation are 21 and 14,
then find ratio of their AMs
6 2 4 7
(1) (2) (3) (4)
7 3 7 4
28. The mean of 2 samples of sizes 50 & 40 were found to be 63 and 54. Their variance were 81 & 36.
Find the variance of combined sample of size 90
(1) 9 (2) (3) 3 (4)
29. The mean and median of some data is 14 and 12 . Later it was discovered that every data element
should be increased by 2 units then new mean and median will be
(1) 16, 12 (2) 16, 14 (3) 14, 12 (4) 10, 8
30. Rohan worked for a firm as given below
No. of weeks Days each week he worked
2 weeks 1 day each week
14 weeks 2 day each week
8 weeks 5 day each week
32 weeks 7 day each week
What is the mean number of days rohan works per week
(1) 5 (2) 6 (3) 5.5 (4) 5.25
Practice Test (JEE-Main Pattern)
OBJECTIVE RESPONSE SHEET (ORS)
Que. 1 2 3 4 5 6 7 8 9 10
Ans.
Que. 11 12 13 14 15 16 17 18 19 20
Ans.
Que. 21 22 23 24 25 26 27 28 29 30
Ans.
MAINSTTS-26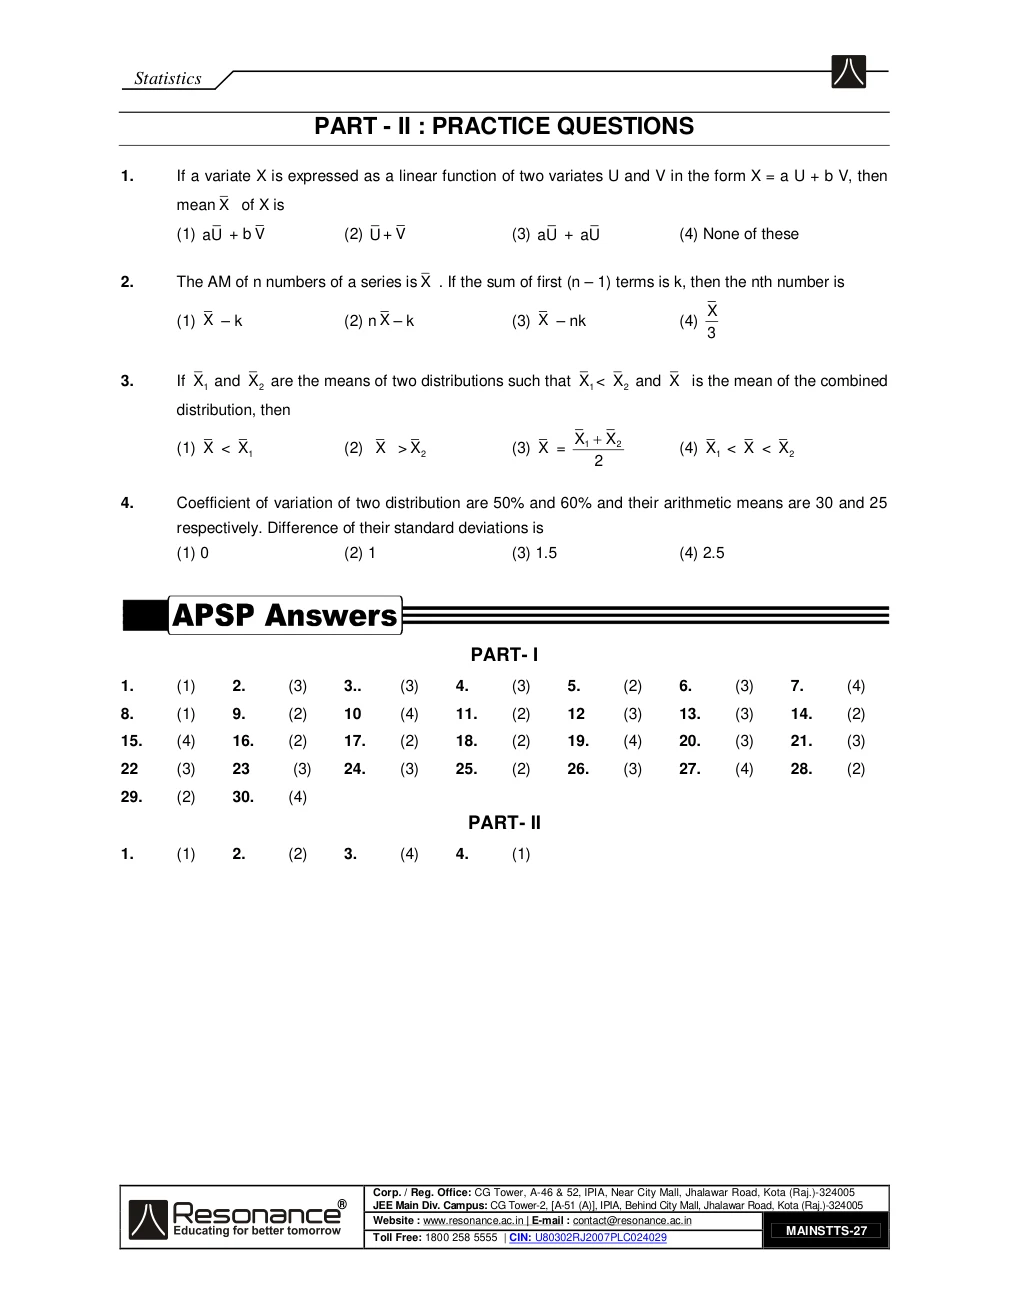
MAASStatistics
© MAAS. All rights reserved.Page 27 / 27
Extracted text · page 27
Statistics
PART - II : PRACTICE QUESTIONS
1. If a variate X is expressed as a linear function of two variates U and V in the form X = a U + b V, then
mean X of X is
(1) aU + b V (2) U+ V (3) aU + aU (4) None of these
2. The AM of n numbers of a series is X . If the sum of first (n – 1) terms is k, then the nth number is
X
(1) X – k (2) n X – k (3) X – nk (4)
3
3. If X1 and X 2 are the means of two distributions such that X1 < X 2 and X is the mean of the combined
distribution, then
X1 X 2
(1) X < X1 (2) X > X 2 (3) X = (4) X1 < X < X 2
2
4. Coefficient of variation of two distribution are 50% and 60% and their arithmetic means are 30 and 25
respectively. Difference of their standard deviations is
(1) 0 (2) 1 (3) 1.5 (4) 2.5
PART- I
1. (1) 2. (3) 3.. (3) 4. (3) 5. (2) 6. (3) 7. (4)
8. (1) 9. (2) 10 (4) 11. (2) 12 (3) 13. (3) 14. (2)
15. (4) 16. (2) 17. (2) 18. (2) 19. (4) 20. (3) 21. (3)
22 (3) 23 (3) 24. (3) 25. (2) 26. (3) 27. (4) 28. (2)
29. (2) 30. (4)
PART- II
1. (1) 2. (2) 3. (4) 4. (1)
MAINSTTS-27